
Introduction
Industrial Control Systems (ICSs) are essential for modern life, as they provide automation in manufacturing, healthcare, transportation, and many other economic and industrial sectors, including critical infrastructure. Cyberattacks on power stations, water treatment facilities, or chemical plants can cause major incidents, ranging from power outages to explosions and massive ecological disasters. Moreover, ICSs are important military targets, as they are part of critical and industrial infrastructure.
After the collapse of the Union of Soviet Socialist Republics (USSR), some Central and Eastern European (CEE) countries underwent fast investment programmes, while others suffered from slow periods of growth and recessions (for more details, see: Stout and Williams, 1995; Walker, 2019). Concurrently in the 1990s and 2000s, Internet-related technologies were on the rise, including advancements in ICS technology. Consequently, CEE was diversified as a region in terms of industrial digitalisation and overall economic progress (Chataway, 1999; Filippov, 2010; Kelly et al., 2017).
The Internet dramatically transformed the threat landscape for industrial systems for the following reasons. Firstly, the knowledge that was previously limited to small groups of specialists and engineers could now be accessed and spread publicly, rendering the so-called ‘security by obscurity’ ineffective (Alcaraz et al., 2012, pp. 120–149). Secondly, since more and more internal networks and computer stations were connected to the Internet, as a consequence some ICSs were no longer operating in isolation (Alexopoulos et al., 2018). For example, the Iranian attack on the New York Dam in 2013 was executed remotely, because the floodgate control system was accessible from the hacked computer (United States District Court, Southern District of New York, 2016). Thirdly, if a vulnerability of industrial standard, device, or protocol is discovered, this knowledge spreads rapidly (Stellios et al., 2019). This creates an enormous advantage for the attackers, as updates of industrial systems often require planning and maintenance breaks. Moreover, device replacement in industrial systems is expensive, so it rarely occurs. It is estimated that a typical device in ICS is exploited for 20 years (controllers), but the security of industrial devices is thought to be obsolete after several years (Bryes, 2013).
There are many threats that can harm CEE industrial infrastructure. The most notable are insiders, cyber gangs, and state-sponsored groups. Insiders are familiar with industrial processes and infrastructure and are able to obtain authorised access to an industrial system. It can be a present or former employee that uses his or her knowledge and privileges to spy, sabotage, or damage an industrial system. Such incidents may be severe and seem to be the most difficult ones to prevent. Nonetheless, being aware of vulnerabilities and eliminating them should make insider threats mitigate the impact (Marco et al., 2021). Ransomware attacks are common acts of cybercrime performed by financially motivated criminal groups that concern critical and industrial infrastructure without exception (Gazzan and Sheldon, 2023). Cyber gangs, however, rarely attack the ICS itself; instead, their attention is focused on related enterprise Information technology (IT) networks. For example, in 2022, incidents involving new ransomware called “Prestige” were reported in Ukraine and Poland, which targeted logistics industries and transportation, including railways (Microsoft, 2022). This malicious cyber activity was likely linked to Russia, since it was focused on important objectives from a military perspective. In fact, state-sponsored attacks in CEE are the most dangerous threats for industrial infrastructure (European Union Agency for Cybersecurity [ENISA], 2022). One of the most notorious acts of cyber terrorism happened on 23 December 2015 in Ukraine and was prepared and executed by the Sandworm Team, a Russian cyber military GRU unit. The attack was sophisticated, and disabled a power grid in numerous stages. The incident resulted in a blackout lasting 6 h, affecting more than 230 thousand people (Lee et al., 2016).
Tracking the state of industrial cybersecurity is a crucial task that could help to supervise and facilitate the elimination of old and vulnerable technology from use. However, the general vulnerability of industrial systems in each country is difficult to assess. Industrial infrastructure is diversified between regions, varies in industrial sectors, and applies multiple standards. Nonetheless, some information can be gathered to create a general estimation. It can be assumed that popular and widespread technologies are visible in online search data, since many people learn how to operate and maintain them. Moreover, it seems reasonable for malicious actors to target known and existing vulnerabilities, especially if affected technology is popular (Li and Liu, 2021). Due to many aspects, such as market shares of companies, historical background, geography, activity in specific industrial sectors, standards and technological solutions, the popularity of specific elements of industrial infrastructure, may differ from region to region.
The main goal of this work is to develop and test an indirect and objective metric that is able to accurately estimate the state of national industrial cybersecurity. The metric should also be easy to calculate and do not rely on additional extensive data collection, such as field studies or surveys. Therefore, it can be easily deployed to measure, monitor, and compare national vulnerability to cyberattacks on industrial infrastructure.
The idea presented in this paper shows that it is possible to estimate the state of national industrial cybersecurity based on combined analysis of online search data and an industrial vulnerability database. The new metric proposed in this work assesses national interest in vulnerable technologies and can be calculated based on publicly available information. The analysis was performed for search terms that are divided into three categories: Programmable Logic Controllers (PLCs), vendors, and industrial communication protocols. Since data for the Russian Federation was inaccessible, 20 CEE countries were examined during this study. In order to validate the estimations obtained, the results were compared with the National Cyber Security Index (NCSI, n.d.) and Global Cybersecurity Index (GCI) (International Telecommunication Union, 2020), which served as a reference.
Methods
This study attempts to estimate the industrial vulnerability landscape in CEE by a new proposed metric, that is, the popularity of vulnerable technologies. This metric describes national interest in technologies that have known security concerns. Calculations were carried out for 20 countries that are commonly known to be a part of CEE: Albania, Belarus, Bosnia and Herzegovina, Bulgaria, Croatia, Czech Republic, Estonia, Germany, Hungary, Latvia, Lithuania, North Macedonia, Moldova, Montenegro, Poland, Romania, Serbia, Slovakia, Slovenia, and Ukraine. The popularity of vulnerable technologies was estimated based on the Google Keyword Planner (Google Ads, n.d.) and the National Vulnerability Database (NVD) (National Institute of Standards and Technology [NIST], n.d.). Since Google does not provide data about the volume of the searched terms for Russia, this country was omitted from the analysis.
The estimation of national interest in vulnerable technologies was performed by juxtaposing the popularity (volume) of search terms obtained from Google Keyword Planner (Google Ads, n.d.) with a number of vulnerabilities associated with the term or search phrase listed in the NVD provided by the NIST (n.d.). The analysis was based on 116 search phrases divided into three categories: companies (i.e. industrial vendors and manufacturers) with fifty-nine search terms, PLCs and related equipment with forty-four entries, and industrial communication protocols with thirteen phrases. The keywords included in the study were selected based on two types of sources, the external reports on the ICS market in Europe (European Cybersecurity Organisation, 2018; Ladder Logic World, n.d.) and online product catalogues from private vendors (Aserto Sp. z o.o, n.d; ASTOR, n.d.; Sterowniki-PLC.net, n.d.). The selection procedure was supervised by industrial automation practitioners that were checking whether products mentioned in the reports were available to buy in CEE based on online catalogues. Data on search volume was collected in Google Keyword Planner for every country defined above for CEE. Since this work is focused on the present industrial vulnerability landscape, the search volume data is limited to 2022 (1 complete year). However, the number of vulnerabilities was recorded for all database entries recorded in NVD before January 2023.
The proposed metric is country-specific and can be explained as the search popularity of terms related to industrial technologies weighted by the associated number of vulnerabilities. For each country, search volume data on terms of interest was collected from Google Keyword Planner. The values obtained were later transformed with a decimal logarithm and normalised according to the highest search volume value observed for each individual country. The data obtained from NVD on the number of vulnerabilities also underwent transformation with a common logarithm and was later normalised to a range of [0,1]. The final values for every search term were calculated for all analysed countries separately as a sum of derived logarithmised search volumes multiplied by their respective logarithmised and normalised vulnerabilities count. The procedure is expressed by the following Equation 1:
where VPc stands for summed term popularity weighed by the associated number of vulnerabilities for a given country c, n is the total number of analysed terms, pi is the popularity of ith term, relates to the highest country-specific search volume, vi represents the number of vulnerabilities associated with the ith term, and vmax is the highest number of vulnerabilities seen in the whole dataset.
Results for all terms, as well as for distinguished categories, have been visualised on maps. The first visualisation takes all the data into account (Figure 1), the second is created for companies (Figure 2), the third for PLC-related terms (Figure 3), and the last one for industrial protocols (Figure 4). The detailed values of summed search term popularity multiplied by the number of known vulnerabilities, that is, VPc, are also included in Table 1 for clarity. Additionally, Table 1 contains reference values obtained from the NCSI (n.d.) project website and GCI (International Telecommunication Union, 2020). Data used to calculate VPc scores (exact keywords with national search volume and associated number of vulnerabilities for each country) was added to the supplementary file (Table S1).
Figure 1
Visualisation of total estimated vulnerability to cyberattacks on industrial systems in CEE. The values represented on the map are summed search term popularity multiplied by the number of known vulnerabilities found in NVD database for the same term (more details in the text).
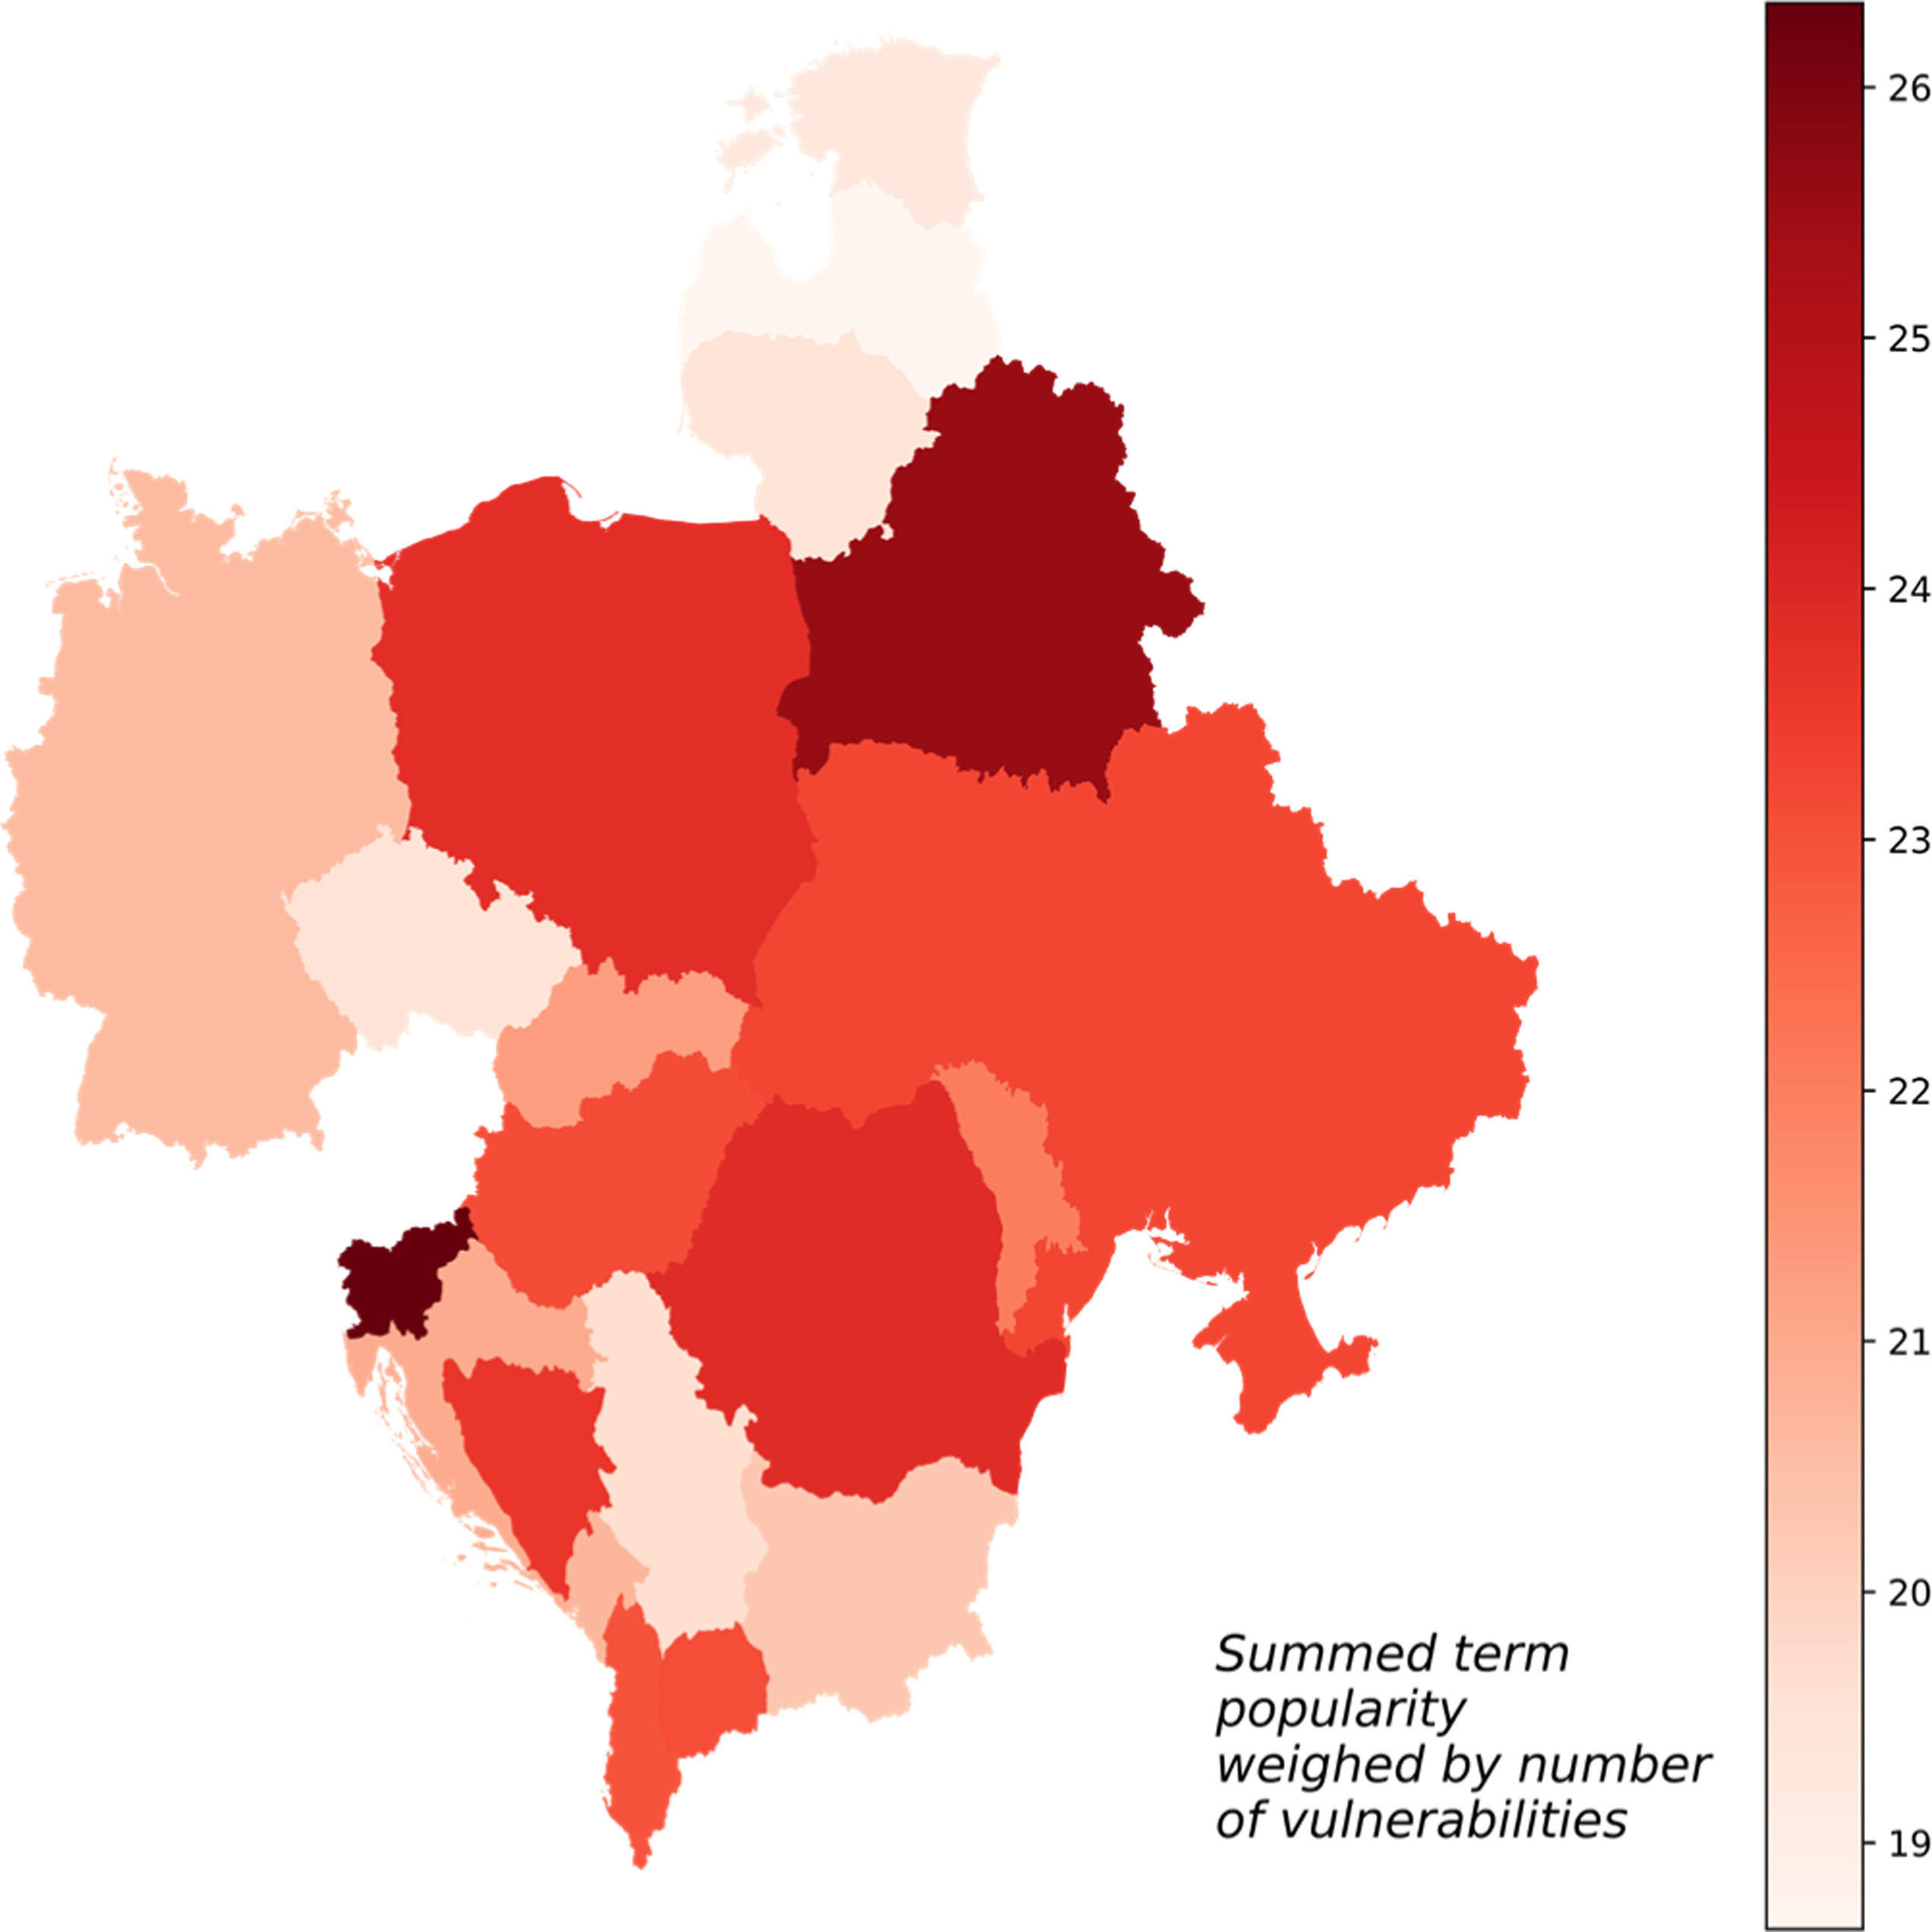
Figure 2
Visualisation of estimated vulnerability to cyberattacks on industrial systems related to vendors and specialised companies in CEE. The values represented on the map are summed search term popularities multiplied by the number of known vulnerabilities in the NVD database for the same term (more details in the text).
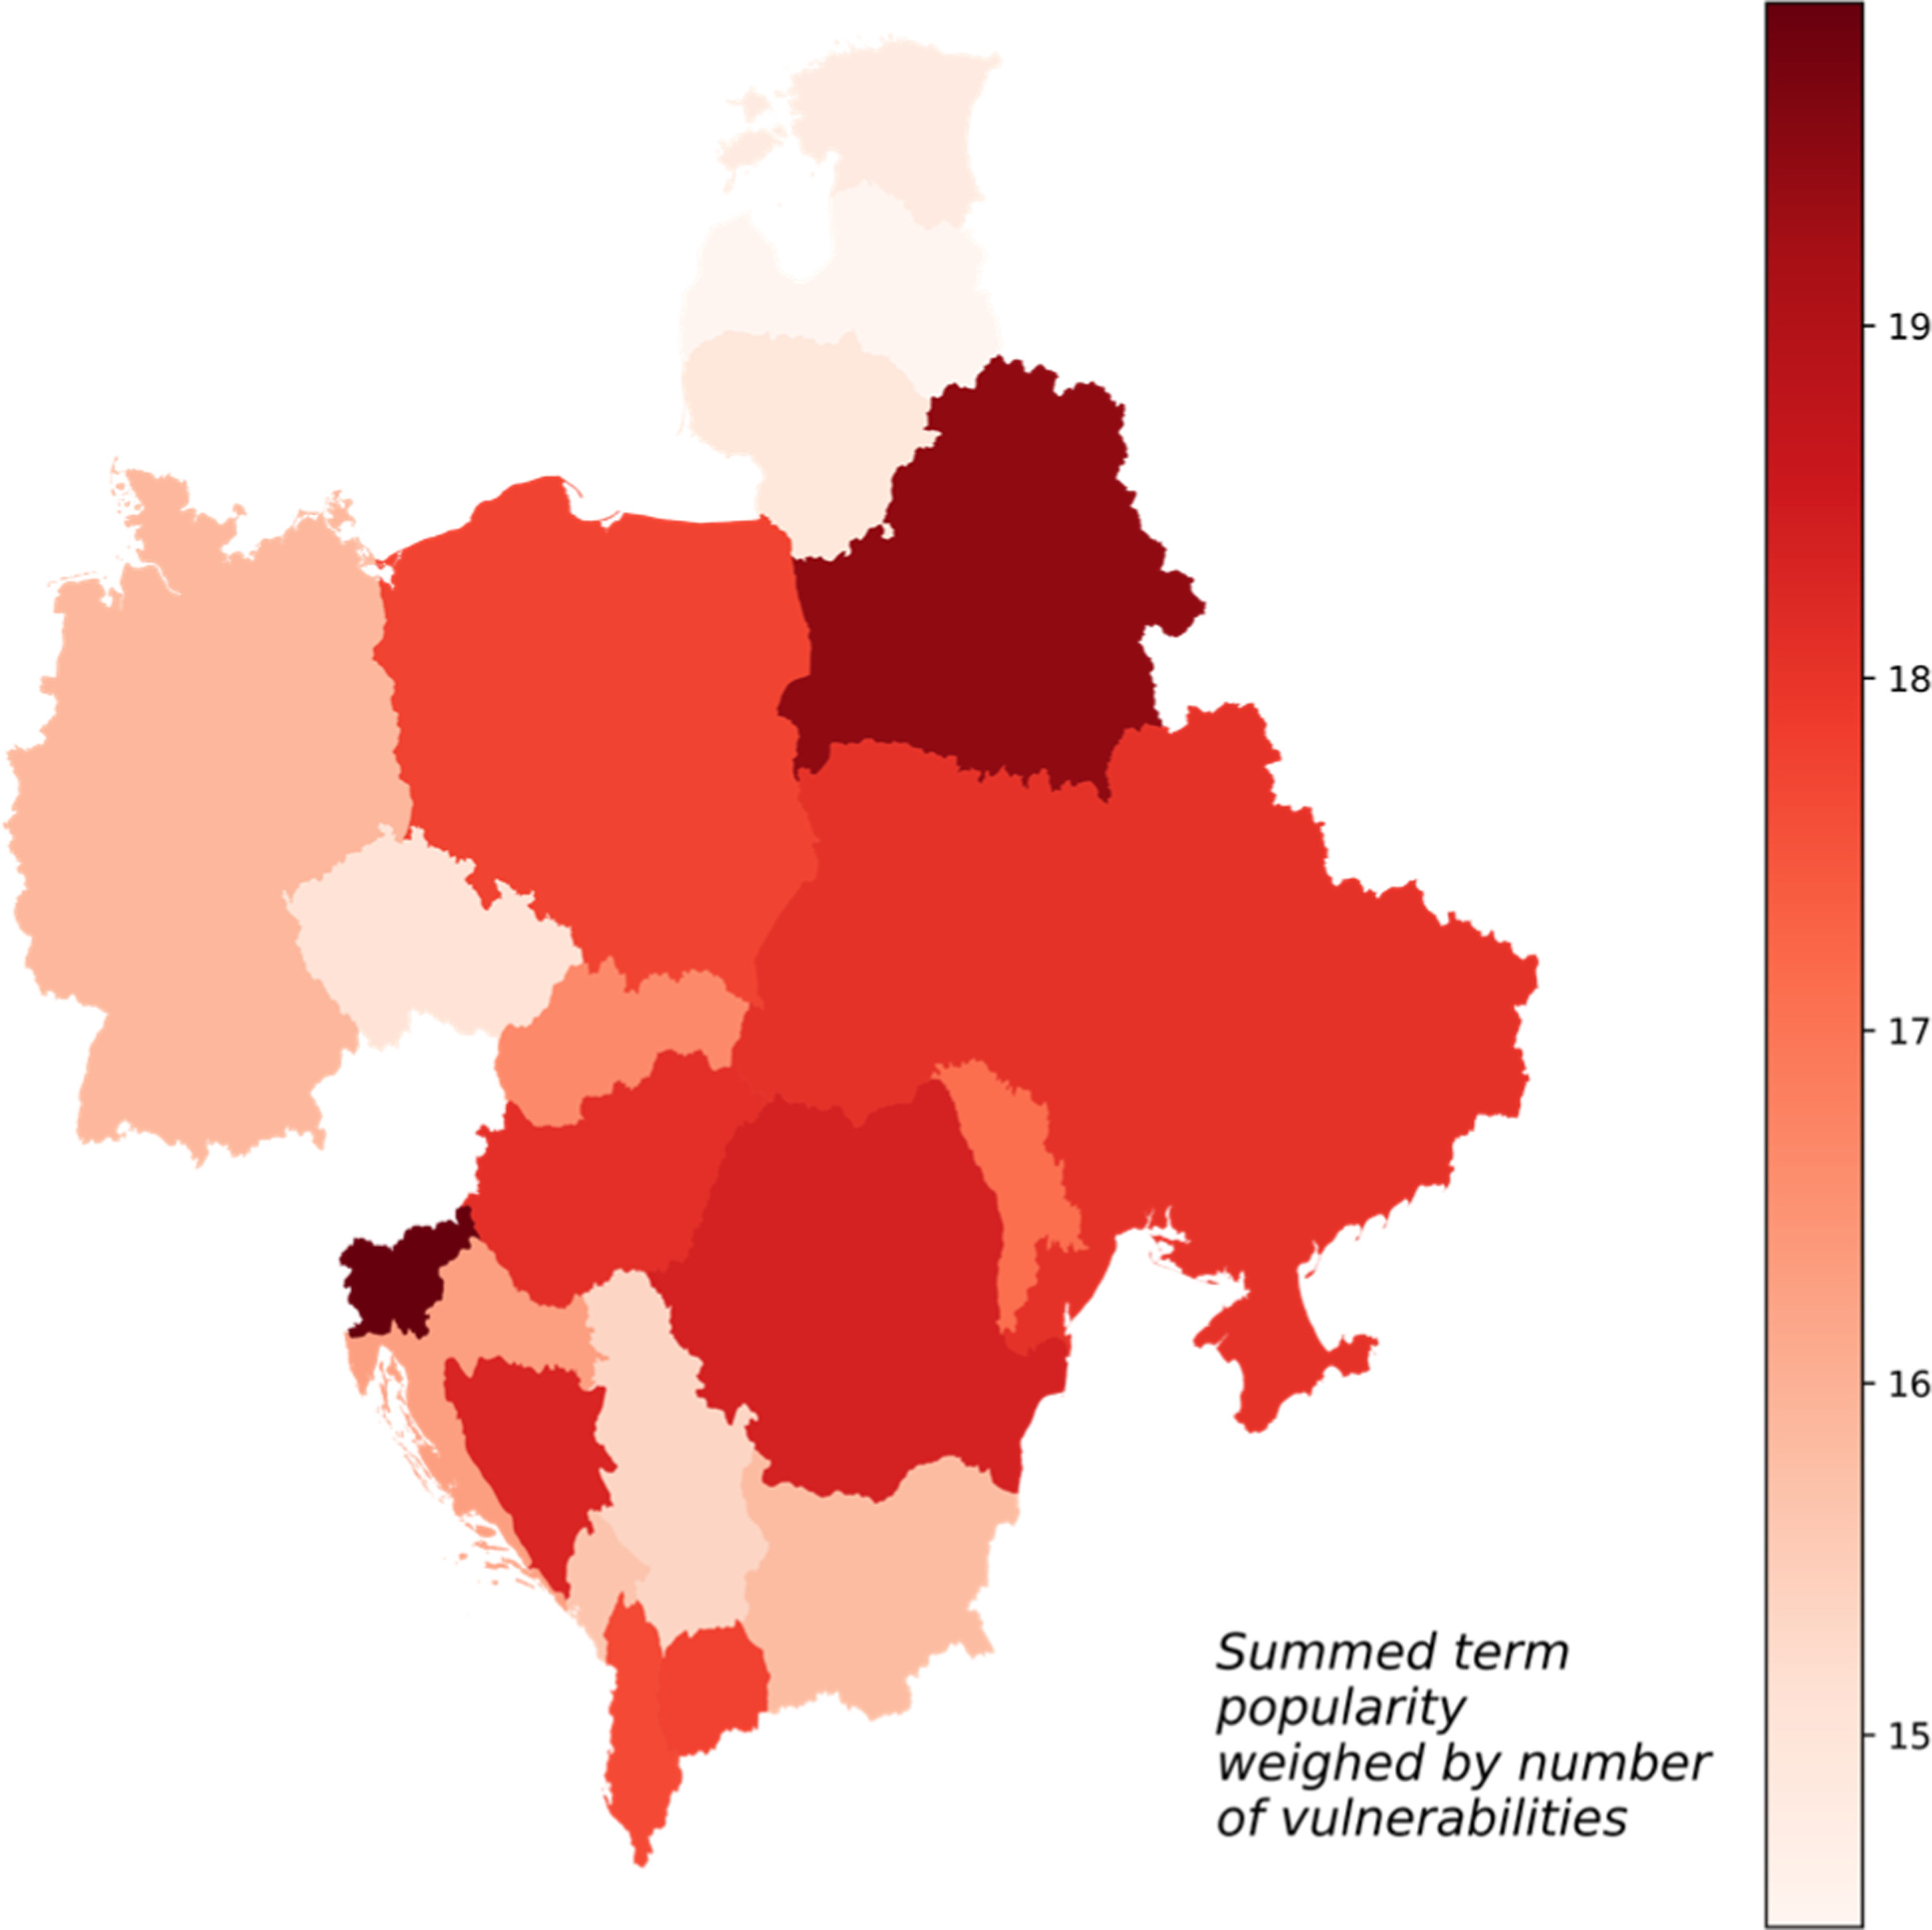
Figure 3
Visualisation of estimated vulnerability to cyberattacks on industrial systems in CEE related to PLCs and industrial equipment. The values represented on the map are summed search term popularities multiplied by number of known vulnerabilities in the NVD database for the same term (more details in text).
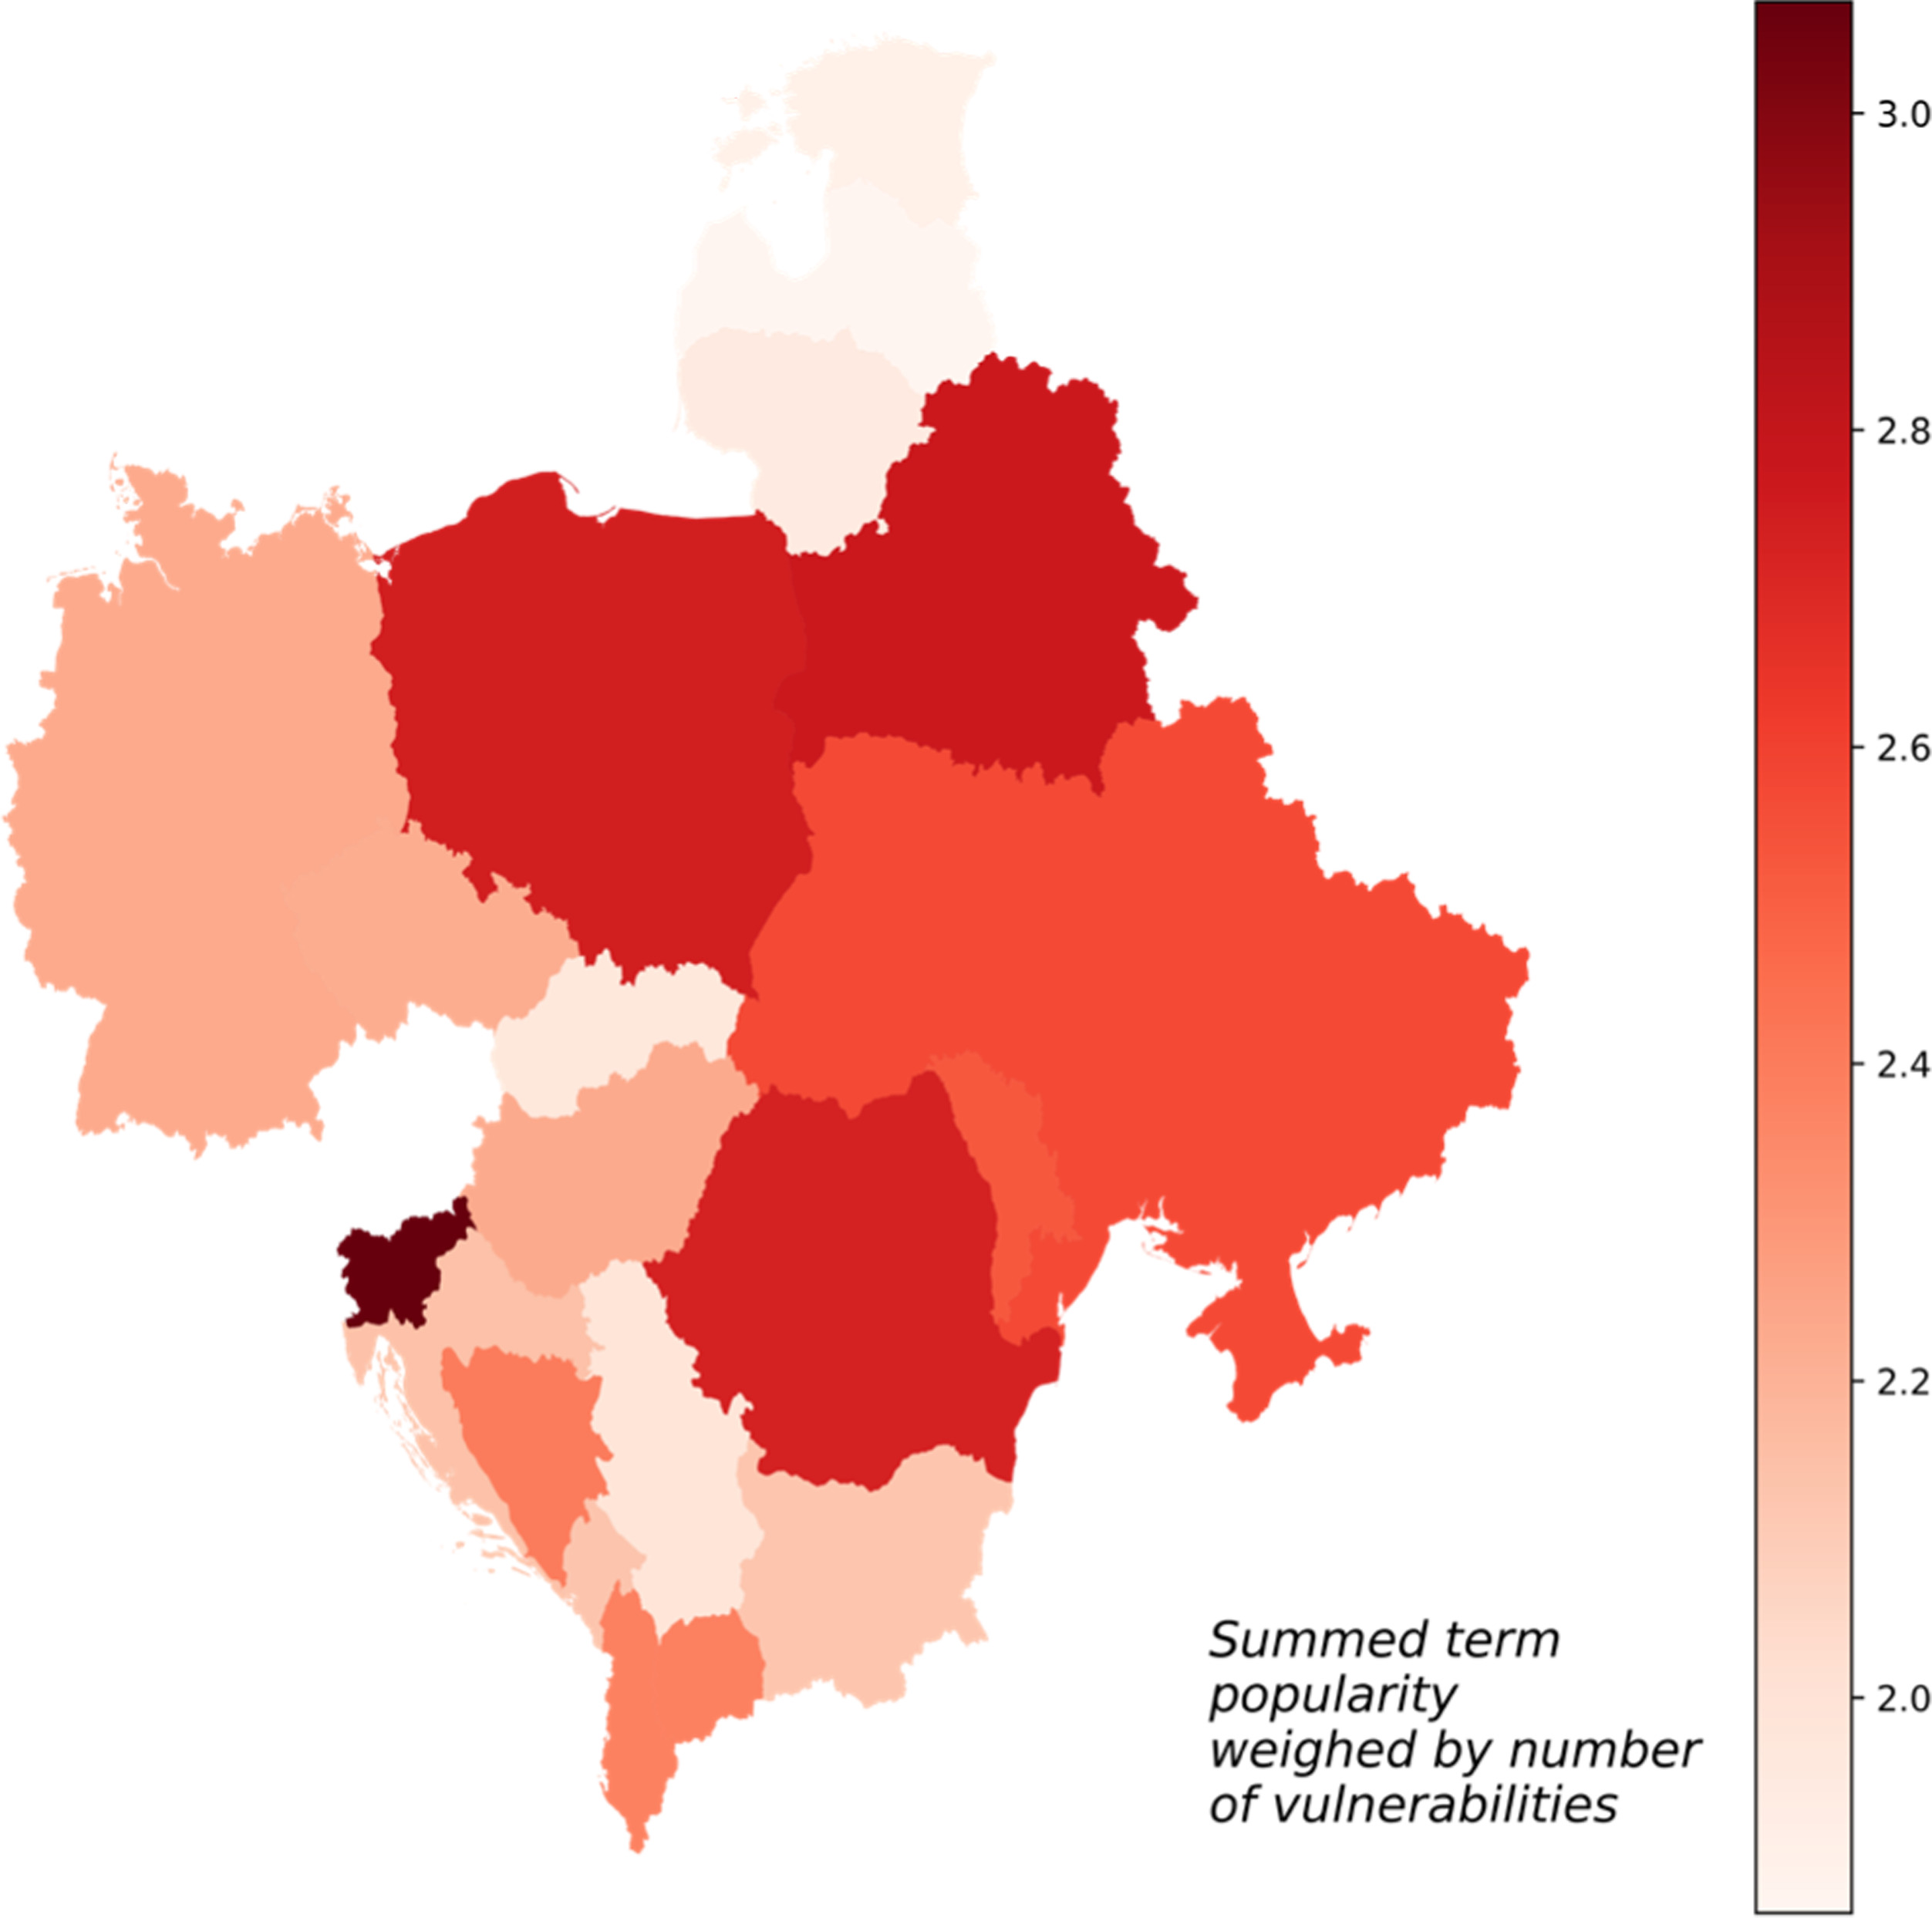
Figure 4
Visualisation of estimated vulnerability to cyberattacks on industrial systems in CEE related to industrial network protocols. The values represented on the map are summed search term popularities multiplied by the number of known vulnerabilities in the NVD database for the same term (more details in text).
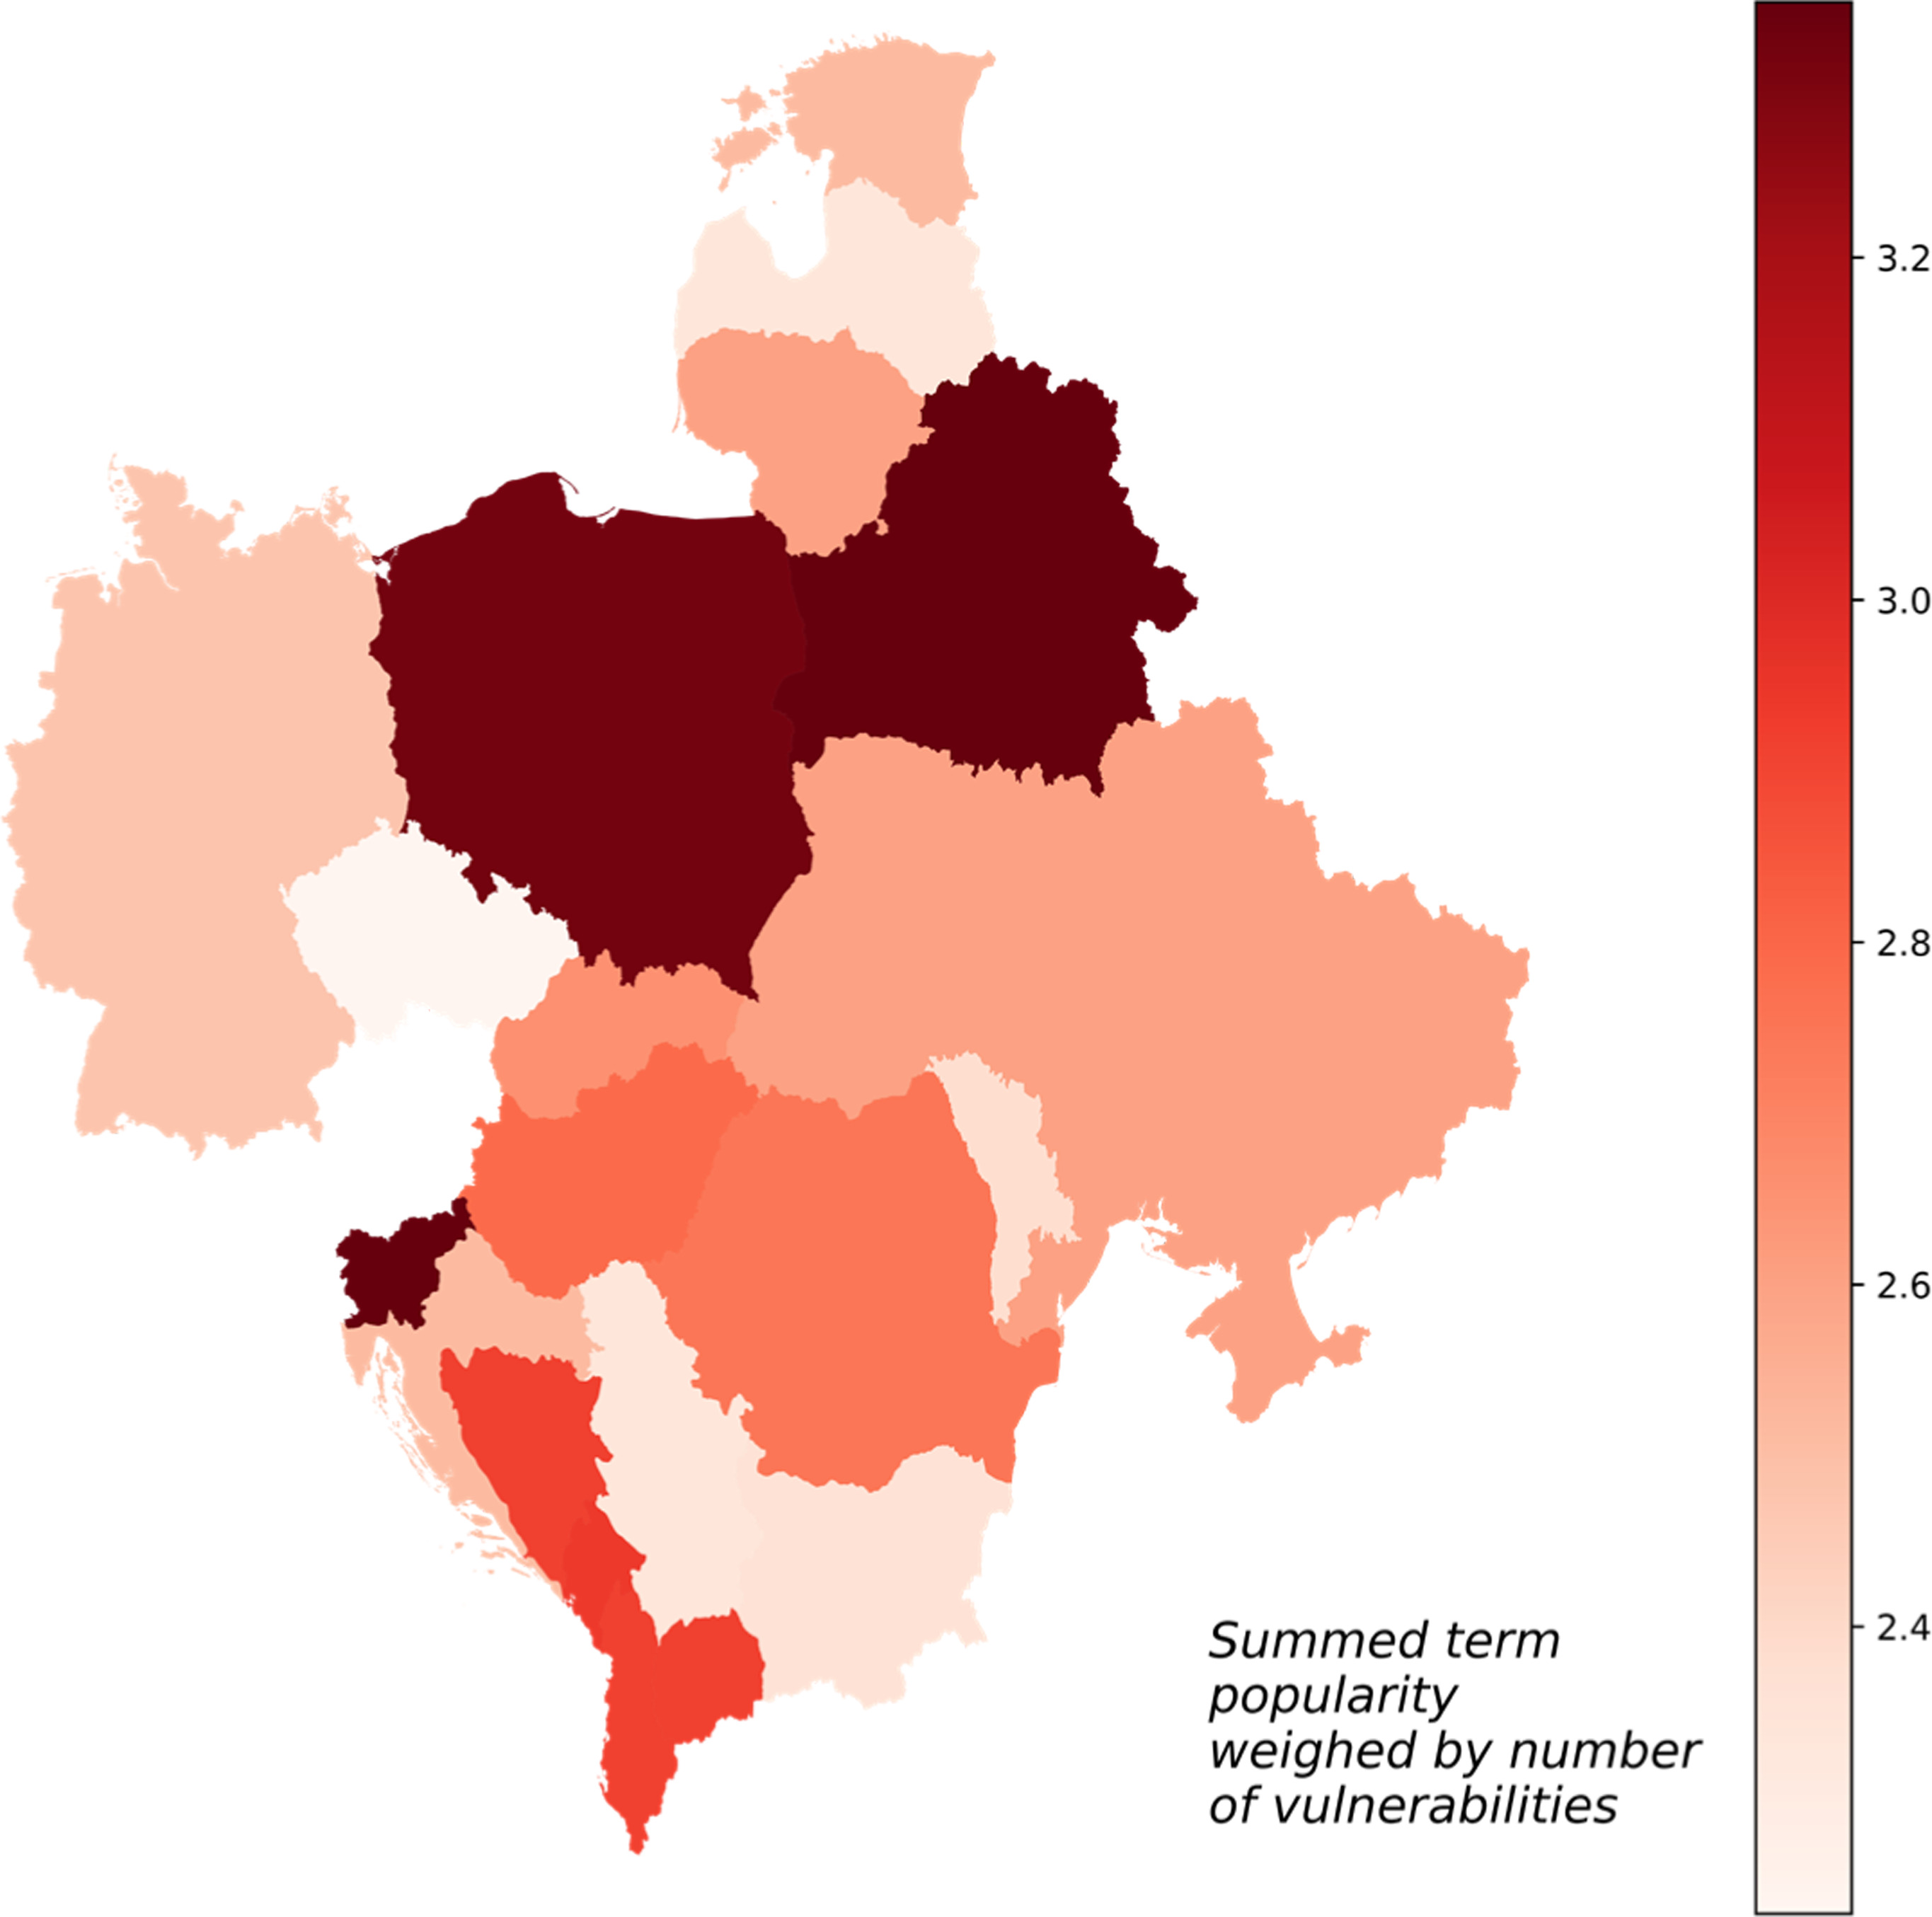
Table 1
Summed logarithmised term popularity weighed by logarithmised number of vulnerabilities (calculated according to Equation 1) for each country in CEE.
In order to compare VPc results with a reference, three values from the NCSI project were used: NCSI, Digital Development Level (DDL), and the difference between the NCSI and DDL for every country analysed in this work. For the same reason, the main GCI score was analysed. VPc scores were compared with values provided by the NCSI project and GCI by Spearman correlation on ranks.
Results
The analysis performed in this study shows that the VPc score agrees with expectations and external reference indexes (NCSI and GCI). The results presented in this work point out the relevancy of the VPc score, although the metric is not flawless and the least expected cases are described in detail below.
As for all terms, the highest total VPc score was detected for Slovenia and Belarus (see Figure 1). A little lower, but high values, nevertheless, were calculated for Albania, Bosnia and Herzegovina, Hungary, North Macedonia, Poland, Romania, and Ukraine. On the other side, Czech Republic, Estonia, Latvia, Lithuania, and Serbia had the lowest total VPc scores. Since terms related to vendors and companies dominated the keyword dataset, similar results were observed for this category. All details are seen in Figure 2 and Table 1. According to Table 1 and the visualisation on Figure 3, for PLC and related equipment, the most vulnerable infrastructure seems to be in Slovenia, Belarus, Poland, and Romania. In addition to that, Moldova and Ukraine also have scores that can be classified as elevated. Some countries score low in the PLC category, that are, Estonia, Latvia, Lithuania, Serbia, and Slovakia. The last analysed group contained terms related to industrial communication protocols and are given in Figure 4. The highest scores in this category were calculated for Belarus, Poland, and Slovenia. High values for industrial protocols were also observed for Albania, Bosnia and Herzegovina, Montenegro, and North Macedonia. In contrast, Bulgaria, Czech Republic, Latvia, Moldova, and Serbia have the lowest VPc score values for terms related to industrial protocols.
Estimation is split into three search term categories: vendors and companies, PLCs and industrial equipment, and industrial network protocols. A column with respective total values (the sum of all categories) is also included. The NCSI, DDL, and the difference between them, as well as GCI in the last column, serve as reference values for VPc and originate from the NCSI (n.d.) project website and International Telecommunication Union (2020) report. Colours are used to show the similarities of VPc scores to NCSI and GCI reference. Red represents the presence of insecure infrastructure in a given country. Red is associated with high VPc scores and low values of NCSI parameters. Low VPc scores and high values from NCSI are marked in blue and correspond to national cybersecurity being in a good state.
The results of Spearman correlation show that a significant relationship exists between total VPc and NCSI (r = –0.4712 and p-value = 0.036). DDL (r = –0.3669 and p-value = 0.1115), and the difference between NCSI and DDL (r = –0.2706 and p-value = 0.2484) do not possess detectable correlations with the total VPc score. The correlation between NCSI and total VPc is moderate but clear. The case for GCI seems to be similar. The correlation between GCI and VPc is comparable to the results obtained for the NSCI scores (r = –0.4827 and p-value = 0.0311). It is worth noting that NCSI scores and GCI are more correlated with each other than with VPc. The relationship between NCSI and GCI is strongest in this data (r = 0.7196 and p-value = 0.0003). Nevertheless, it was not expected that industrial cybersecurity would reflect the IT one. In conclusion, the VPc score seems to be a promising estimation for the national industrial vulnerability landscape and could be adopted by security monitoring agencies.
Discussion
There are many general measures and indicators for assessment of regional cybersecurity conditions. Such measures are used by various institutions, such as public agencies and private companies. In general, three main types of indicators commonly used in cybersecurity are distinguished, that is, marker-, survey- and expert-based, each with its own set of advantages and disadvantages.
Marker-based indicators rely on specific measurable events or artefacts within the system, such as the number of instances of detected malware, frequency of unauthorised access attempts, and patch management statistics. In fact, the VPc score is another marker-based indicator, since it relies on statistical data of a number of vulnerabilities and keyword search popularity, all of which is assumed to be correlated with the state of industrial cybersecurity. There are some advantages associated with these types of indicators. One of the most important advantages is that marker-based measures are easily deployed objective methods for assessing cybersecurity situations. These indicators provide quantifiable data that allows comparison and tracking over time, which is important for bias elimination. Marker-based indicators are also easy to automate. For the VPc score, it is possible to create a simple online data analyser that presents current and past values without any additional manual work. Another good trait of marker-based indicators is that they can be tuned or redesigned to track very specific security aspects, for example, the VPc score can be easily adapted to focus on different regions or sets of technologies. Nonetheless, there are some major disadvantages to the metric-based approach. One of the most important drawbacks is issues related to interpretation struggles. It is a common case that a high number of independent variables may influence a marker value, the case for VPc is no different. In addition to this, markers are data-dependent, so their focus is limited, based on information they encompass. Finally, although markers are usually correlated with cybersecurity state, they can become unreliable over time, especially due to new technological breakthroughs (Meland et al., 2021).
Survey-based indicators are most popular in the cybersecurity domain. On the one hand, surveys are able to provide more holistic views, measuring multiple security aspects. This is a highly flexible security estimation technique, since a survey can be designed to address chosen security issues. Moreover, there are aspects where surveys are the best source of information, and this is especially true for behaviour-related security assessments (Chaudhary et al., 2022). On the other hand, survey accuracy suffers from badly designed forms that may lead to misinterpretation and bias. In some cases, a low number or false responses may strongly influence an indicator. In fact, response rates may be subject to manipulation and artificially augmented, which can lead to misinformation. On top of that, surveys are resource-consuming, requiring time to be designed, distributed, and -analysed (Cadena et al., 2020).
Lastly, there are expert-based indicators that are usually presented in the form of articles or reports. Experts can provide a deep, nuanced understanding of cybersecurity risks, incorporating both technical and strategic perspectives. Their experience allows potential future threats and vulnerabilities to be identified, offering predictive insights that can guide proactive measures. Experts can also consider the unique context of the organisation, including industry-specific threats and the specific operational environment. However, expert-based indicators can be affected by personal bias and subjective judgements, which undermine objectivity. Engaging experts for assessments can be expensive and time--consuming, limiting the frequency of evaluations. Finally, relying on expert assessments may not be scalable for large organisations with extensive and diverse operations, where continuous monitoring is required (Krisper et al., 2020).
In the report published by the European Union (EU) on cybersecurity indexes, there are at least sixty different indicators used to monitor the security state in member countries (ENISA, 2024) and all of them are marker- or survey-based. These indicators are designed to measure investment project impact based on normalised statistical data (EUROSTAT), the number of reported incidents (ENISA), legislative data (Council of Europe), and surveys filled in by companies and public institutions (MS Survey). Unfortunately, none of the indicators published in the report was strictly dedicated to industrial cybersecurity. The EU also suggested a specification based on twenty-two quality features that all reliable indicators should have. The traits of a good indicator include precision, validity, ability to systematically collect data, neutrality, and transparency (ENISA, 2024).
It is important to mention that the EU uses online device scans and statistics provided by Shodan (no date). Although this commercially available portal is valuable for regular IT cybersecurity, it is not the case for the industrial sector. Shodan scans devices connected to the Internet and reports back on non-secure entities based on defined features. Most industrial devices are, in general, isolated from the Internet and therefore unreachable for Shodan. Nonetheless, there are attackers, such as the currently common Russian hacktivists, that target industrial devices reachable online (Cybersecurity and Infrastructure Security Agency [CISA], 2024). In fact, professional hackers are able to access industrial networks by other means, for example, supply chain compromise and infected removal media.
The presented estimation of the vulnerability landscape for industrial systems in CEE is not difficult to perform, but the results rely on markers and should be interpreted with caution for the following reasons. Firstly, there are multiple causes for which certain terms are searched, even if the phrase is very specific for ICSs (e.g. RX3i). For example, the term may be googled by students, because certain technology is simply popular in educational laboratories and textbooks (Adamo et al., 2007). It is possible that foreign entities may be interested in devices used in other countries. Terms may also be googled in a different context that is not related to ICSs at all. Secondly, it shall be noted that the analysis was performed using the assumption that all terms were searched in English. This may not be true in Europe, where the popularity of English language varies (Sim, 2008). Moreover, countries, such as Serbia and Ukraine, use Cyrillic script, which can cause the results to be biased. Another major issue may be the choice of search engine; this analysis assumes that Google is equally popular in complete CEE (StatCounter, n.d.). In addition to that, Google Keyword Planner is actually one of many tools used for advert placement and trend monitoring and it will never replace accuracy that can be achieved by incorporation of sales data and on-site asset stocktaking. Furthermore, it is worth noting that VPc has a statistical character, that is, it gains accuracy and reliability when calculated on massive and diverse datasets. Therefore, relying solely on NVD may introduce additional biases. A proper index should operate on multiple data sources, especially if they originate from an area under investigation. Lastly, it is possible to carefully pick a set of terms that are capable of supporting any narrative. In fact, it would be extremely difficult to eliminate bias in any of general indexes and matrices that estimate properties of infrastructure, and VPc is not an exemption. Nonetheless, large sets of search phases ought to be less easily manipulated (Skelly et al., 2012). All the reasons listed above should be kept in mind while interpreting the VPc score.
In general, the values of VPc indicate national interest in vulnerable industrial technologies and may be useful for industrial security state estimation. Although the proposed VPc metric may have some drawbacks, the obtained values of VPc seem to be reasonable in most cases. In order to create a reference for VPc, three additional columns are placed in Table 1, that is, the NCSI, DDL, and the difference between them. These security parameters were taken from the NCSI (n.d.) project website. NCSI data, in general, agrees with the proposed metric; however, there is a possible normalisation issue that must be mentioned. Although Slovenia was assigned a low NCSI, it has the highest VPc score. The reason for this may be the chosen normalisation scheme that made the VPc values strongly dependent on the highest normalised search volume of the most popular keyword. If search terms are not properly chosen, then the results can be biased. Hopefully, the risk is minimised for larger sets of search phases; nonetheless, this issue is the weakest element of the VPc score.
The International Telecommunication Union (2020) publishes GCI, which is composed of the following five domains: legal, technical, organisational, capacity development, and cooperative. The Index is designed to measure the commitment of countries to cybersecurity at a global level based on replies to a questionnaire prepared by experts. Information on GCI values for analysed countries are mentioned in Table 1. Correlation between the VPc and GCI values revealed the same degree of correlation between these metrics as was detected for VPc and NCSI. This may be explained by the strong correlation between NCSI and GCI. Both of these metrics are used to assess cybersecurity states of countries suffering cyberattacks from Russia (Ukraine, Georgia, and Estonia), showing their importance as estimators of digital development (Yerina et al., 2021), which can also partly be reflected in the level of cyber defence ICSs.
Industrial cybersecurity assessments are dominated by expert opinions. The reports are often prepared by industrial cyber intelligence teams associated with major industrial cybersecurity solutions. Companies such as Dragos or Kaspersky prepare periodical and specialised reports that address current threats for industrial networks and major regional security issues. Unlike marker- and survey-based assessments, experts are known to express predictions and anticipations of changes in technology. For example, the operational technology (OT) cybersecurity review of 2023 published by Dragos Inc. (2024) is focused on current conflicts and new threats, rather than vulnerability assessment. Similarly, periodical expert reports on industrial cybersecurity developed by Kaspersky mainly cover new threats to ICSs (Kaspersky ICS CERT, 2024).
Finally, there are reports related to vulnerability of indusial automation technologies in CEE that can be comparted with VPc results. According to the report about the readiness of central and eastern EU countries for Industry 4.0 (Naudé et al., 2019), the Czech Republic, Lithuania, Hungary, and Slovenia have the highest potential for adoption and deployment of new industrial technologies. However, Bulgaria, Slovakia, Romania, and Poland are least prepared for adoption of technologies related to Industry 4.0. These conclusions are obtained by combining the most crucial aspects of industrial transformation capacity (i.e. technological, entrepreneurial, and governance competencies). In general, the VPc scores reflect conclusions presented in the report for six out of eight analysed countries. Not in line with the report, the VPc values obtained for Hungary and Slovenia are higher than average. A similar argument may be made for NCSI. As mentioned before, the VPc score for Slovenia might be biased by normalisation, but this is less likely for Hungary. Despite these differences, the conclusions in the report match with most VPc scores, especially in the case of Poland and Romania. These countries have been estimated by VPc as more vulnerable to cyberattacks on ICSs which was in disagreement with NCSI.
Conclusions
Many different industrial technologies exist in CEE. Regions differ in their deployment of novel technologies and there are many facilities that still operate on vulnerable devices and systems. As described in this work, the VPc score shows the industrial vulnerability landscape for multiple countries in CEE. The VPc score aligns with expectations and correlates with external benchmarks, such as NCSI, GCI, and EU reports. It highlights Slovenia and Belarus as having the highest/worst VPc scores overall, with several other countries in Eastern Europe also showing elevated scores. Conversely, countries such as Czech Republic, Estonia, Latvia, Lithuania, and Serbia had the lowest VPc scores, which can be interpreted as high cyberattack resilience in the industrial automation sector. Vulnerabilities related to PLC and industrial communication protocols were particularly notable in Slovenia, Belarus, Poland, and Romania. Statistical analysis revealed a moderate correlation between the VPc and reference scores (NCSI and GCI), which was anticipated, since industrial cybersecurity does not have to perfectly mirror the IT one.
Based on the findings of this study, several recommendations for policymakers and investors can be derived. Firstly, there is a clear need for increased investment in industrial control and automation systems in Romania, Bosnia and Herzegovina, Albania, Bulgaria, Poland, Belarus, and Slovakia. These countries appear to rely on outdated and vulnerable technologies that require modernisation. Secondly, the Baltic states, namely Estonia, Latvia, and Lithuania, exhibit high resilience to potential cyberattacks, indicating that their defence strategies are effective and should be maintained and supported. Lastly, the VPc measure provides insights into vendor market shares in Romania, Belarus, and Bosnia and Hercegovina, where companies with a greater number of vulnerabilities are common. VPc can serve as a valuable tool in reports aimed at informing political decisions and guiding investment strategies. In this case, both legal and commercial actions are needed to promote trustworthy industrial vendors and standards.
Tracking general security trends in industrial infrastructure is difficult and time--consuming. VPc is able to overcome these limitations, but at a cost associated with susceptibility to bias. Firstly, search term popularity is influenced by various non-industrial factors, such as academic or educational interest in specific technologies. Secondly, English-language dominance in search queries may overlook regional preferences, such as the use of Cyrillic script in countries such as Serbia or Ukraine, potentially skewing results. Additionally, relying solely on Google Keyword Planner may not capture the full spectrum of data, as it primarily serves advertising. Moreover, the VPc score's statistical nature implies greater accuracy with larger and more diverse datasets, suggesting that exclusive reliance on sources such as NVD could introduce biases. To mitigate these issues, a robust index should integrate multiple data sources relevant to the specific area of investigation. Finally, careful selection of search terms is crucial to avoid bias and ensure the VPc score's reliability in reflecting infrastructure properties. Although VPc has many drawbacks, it can be useful as a general metric and help to track changes in national industrial cybersecurity.
Industrial infrastructure is one of the main targets in modern hybrid warfare. European countries are already suffering from intense cyberattacks from both foreign state agencies and criminal organisations. Therefore, multidimensional and complex analysis of the industrial cyber vulnerability landscape, as well as monitoring its development, is important to prepare and deploy proper defence plans (Kayan et al., 2022). The VPc score can only be a part of realistic infrastructure security assessment; however, it reveals information about general interest in vulnerable technologies. The interest itself may also point out which attacks are more (or less) likely or signal that more investments are needed to modernise and secure industrial infrastructure. In addition, the score may trigger changes in the education of skilled personnel that is essential in specific industrial sectors. It is worth noting that the VPc score can be used by security researchers to identify and predict spreading across different countries. The VPc score may also be deployed to plan and coordinate investments in industrial security at international (EU) level as well as regulate usage of vulnerable industrial technology and standards by law, enforcing cybersecurity standards.
Finally, the VPc score introduced in this work should be validated by regional infrastructure studies. Vulnerability analysis of industrial technologies and equipment based on real inventory lists may be a better source of data. This can be achieved by modern security systems for industrial networks that are capable of inventory analysis and vulnerability detection, such as the SCADvanceXP (Twardawa et al., 2024). Future work on the VPc score should also improve scaling and the normalisation procedure. For example, creating a list of referential and validated search terms may to a large extent eliminate the problem of wrong scaling of search volume. Additional effort should also be made to take into account search phrases in the official language of each analysed country. Nevertheless, the VPc score has a great potential for studying regional industrial infrastructure vulnerability to cyberattacks.