
Introduction
The sources of intelligence information
With the explosion of available intelligence information from an ever-increasing number of sources, consolidating relevant information into a manageable solution is a major challenge for military leaders all over the world. The multi-intelligence (INT) solution that includes approaches, functions, and capabilities for intelligence operations at all levels, from strategic to tactical, for security and defence decision-making end users is a popular way of dealing with this issue. The approach is to handle and collect all the available intelligence information which entails gathering pertinent intelligence from a variety of sources, processing it, and combining it into unique intelligent core processing. Intelligence information is the product that results from the collection, collation, evaluation, analysis, integration, and interpretation of collected information from different types of sources (Federation of American Scientists, 2023).
The intelligence cycle (IC) is the process of gathering data and turning it into intelligence for IC clients to use. Direction, collection, processing, exploitation, and distribution are the steps in the process. IC products can be created by a single IC element or in collaboration with other IC elements and given to IC clients in a variety of formats, such as papers, digital media, briefings, maps, graphics, videos, and other delivery methods. There are the main routes and some sub-branches of collecting intelligence that are often referred to as “intelligence collection disciplines.”
In imagery intelligence (IMINT), images of objects are reproduced optically or electronically on film, electronic display devices, or other media, and intelligence information is derived from the collection, exploitation, and analysis of imagery by visual photography, infrared sensors, lasers, electro-optics, and radar sensors, such as synthetic aperture radar (SAR). The analysis and visual representation of security-related activities on the Earth is known as geospatial intelligence (GEOINT). It is made possible by a combination of imagery, IMINT, and geospatial data. Open-source intelligence (OSINT) refers to a wide range of publicly available information and sources, including news (newspapers, radio, television, etc.), professional and academic records (papers, conferences, professional associations, etc.), and public data (government reports, demographics, hearings, speeches, etc.). Social open-source intelligence (SOSINT) is a new branch and development of OSINT. SOSINT is what “new” media, such as Facebook, Instagram, Twitter, LinkedIn, Snapchat, and other social media platforms, are all about, and it’s the division from “old” media, such as newspapers and radio, that defines OSINT. Electronic transmissions that can be collected by ships, planes, ground stations, or satellites are referred to as signals intelligence (SIGINT). Communication intelligence (COMINT), electronic intelligence (ELINT), and foreign instrumentation signals intelligence (FISINT) come under the umbrella of SIGINT. The collection of information, as well as the review, coordination, and supervision of collection programs and activities involving human assets, is referred to as human intelligence (HUMINT). The scientific and technical intelligence information obtained by quantitative and qualitative analysis of data collected by specific technical sensors is known as measurement and signature intelligence (MASINT). Other types of intelligence sources, such as financial intelligence (FININT) and cyber or digital network intelligence (CYBINT or DNINT), are also very important. FININT is the gathering of financial information about entities of interest in order to better understand their nature and capabilities as well as predict their intentions. Financial intelligence is used to identify financial transactions that could be related to tax evasion, money laundering, or other criminal activity. The process of explicitly gaining intelligence from available Internet resources is known as CYBINT. OSINT can be thought of as a subset of CYBINT (Groce, 2022; Martin, 1994).
The combination of IMINT and GEOINT with other intelligent sources
There are reviews of many approaches that combine IMINT and GEOINT with other intelligent sources and especially OSINT. In the last 8 years, there has been nothing short of a revolution in the area of OSINT (intelligence obtained from publicly available data) that can be combined with IMINT (it analyses Earth observation (EO) images gathered by assets ranging from satellites to spies). The example of what happened in Ukraine endorses the approach that IMINT, GEOINT, and OSINT will play a crucial role on that stage of application (Abramowicz, 2022).
There are plenty of new publications, projects, and applications that manage to fuse the advantages of the IMINT, GEOINT, OSINT, and SOSINT information. Karamvasis et al. (2021) manage to link EO satellites, social media, and crowd sourcing information against terrorism and organised crime. The result of that link shows that the relationships between information from EO data and information from OSINT analysis can considerably assist the important work of law enforcement organisations. Part of the work carried out in this paper has received funding from the European Space Agency (ESA) within the framework of the EO Science for Society (EOEP5 Block 4) – Expanding Demand for EO Derived Information EOLAW Project, where Planetek Hellas is in charge of the terrorism and organised crime domain. The comparative advantages of IMINT, GEOINT, and OSINT in the military field mentioned by Ziółkowska (2018) included the use of OSINT in military diagnosis. This paper concludes that for military intelligence, the social support of the armed forces and their actions is important. This information can be obtained from OSINT. Munir et al. (2022) proposed a model for situational awareness in the army with dynamic decision-making that incorporates artificial intelligence (AI) and dynamic data-driven application systems to adapt measurements and resources in accordance with changing situations. Inside their overall model architecture, one of the modules that improve the accuracy of the situational awareness is a sub-module that gathers intelligent information from multiple sources.
A markedness product that joins the comparative advantages of IMINT, GEOINT, and OSINT for the military end users is AIRBUS’s multi-intelligence (INT) solution (AIRBUS, 2023). With the explosion of available data, from an ever-growing plethora of sources, consolidating relevant information into a manageable solution is a major challenge for military leaders all over the world. To respond to this challenge, they have developed a complete multi-intelligence solution which provides tools, functions, and capabilities for intelligence operations, from strategic to tactical levels for the National Defence Intelligence community, in support of operations.
The case study of Russian invasion of Ukraine
The Russian invasion of Ukraine on 24 February 2022 heralded a new “social media war” era. OSINT and SOSINT information has a crucial role and impact in shaping the war. Social media has become a primary source of information for news-hungry audiences around the world trying to make sense of the Russian invasion of Ukraine. Since the start of the Russian invasion of Ukraine, social networks have been flooded with videos from both sides. With mobile phones in hand, soldiers and civilians are documenting the war as it happens. Social media has become a part of the battlefield. OSINT and SOSINT experts have an enormous amount of intelligent information to collect, analyse, and disseminate–integrate publicly sourced information (Tapete and Cigna, 2019; Tropin, 2021).
An attractive application that uses OSINT and SOSINT information with geographic information system (GIS) technology and maps the war is the Centre for Information Resilience’s Eyes on Russia project, which has operated since January 2022 with one simple goal: to provide timely and reliable information to the world (Strick, 2023). The map acts as a repository of verifiable information that justice, accountability, and advocacy groups can use.
Russia’s employment of military and non-military tools—whose acts are referred to as “hybrid warfare”—will be its primary approach to counter any Western advances near its borders. Therefore, examination of the conflict in Ukraine must be treated not just from a military viewpoint but also from the standpoint of communicational strategy, where propaganda and deception have become effective instruments in modern tactics. Therefore, “hybrid warfare” extends beyond the military landscape and includes attacks in cyberspace and fake news with the aim of destabilising governments, as has been the case in Ukraine.
Purpose of the study
This paper aims to map the current state of art approaches for IMINT with OSINT technologies in order to improve the quality and accuracy of decision-making for humanitarian support and situational awareness. The importance of achieving the highest accuracy in multi-added-value information and fusion from other multiple intelligence sources, such as IMINT, GEOINT, OSINT, HUMINT, MASINT, and SIGINT, is also highlighted. We therefore propose a high-level architecture based on IMINT and GEOINT methods that integrates added-value intelligence information from OSINT, SOSINT, and other INTs, creating multi-intelligent knowledge for security and defence decision-making end users. We also apply a literature review that maps the state-of-the-art AI algorithms for defence and security applications using EO satellites, including object (pinpointing the object’s position using a bounding box) and change (finding pixels that have undergone “semantic change”) detection algorithms. Finally, we carried out OSINT and IMINT analysis by monitoring the Russian invasion of Ukraine on 24 February 2022. This marked the beginning of the first “social media war” in a new era. This type of “hybrid warfare” extends beyond the defence landscape to include EO data and social media.
Methods
IMINT with Earth observation datasets
The basic data sources for IMINT and GEOINT are the satellite images and the geographic datasets produced by them, such as geographic datasets from ground-based procedures like fieldwork or surveys. The acquired data is usually in the form of digital imagery. The surface of the Earth can be examined from several platforms, each with its own advantages and disadvantages. Aerial platforms, for instance, often offer the highest resolutions and are very adaptable to the needs of the user, but the expense of chartering a plane and paying the associated labour (pilots and technicians) restricts its use. Drones, also known as remotely piloted aircraft systems (RPAS), are a rapidly expanding technology that addresses this cost issue; but laws and their poor carrying capacity limit their scope of activity at present. Satellites, on the other hand, enable dependable, real worldwide coverage even above the most remote locations, thereby enabling repeated observations. Most of the satellites that are used for (EO) application are low Earth orbit (LEO) satellites. LEO satellites occupy the lowest orbit of all satellite types, often between 800 and 2,000 km, primarily addressing science, imaging, and low-bandwidth telecommunications needs. The medium Earth orbit (MEO) has historically been used for global positioning system (GPS) and other navigation applications such as GPS, Glonass, and Galileo, as well as in polar orbit to provide coverage at extreme latitudes. Geostationary Earth orbit (GEO) satellites match the rotation of the Earth as they travel, and so remain above the same point on the ground. GEO satellites are primarily used for meteorological purposes.
OSINT and SOSINT collections
OSINT collection can be categorised into two groups: passive and active collection. While active collection uses a variety of techniques to collect data, passive collection involves the use of threat intelligence platforms (TIPs) (Toivonen et al., 2019). The most common OSINT resources are depicted in Figure 4.
Figure 1
The web GIS map of the Center for Information Resilience’s Eyes on Russia project shows the location of the OSINT and SOSINT information in context (Strick, 2023).
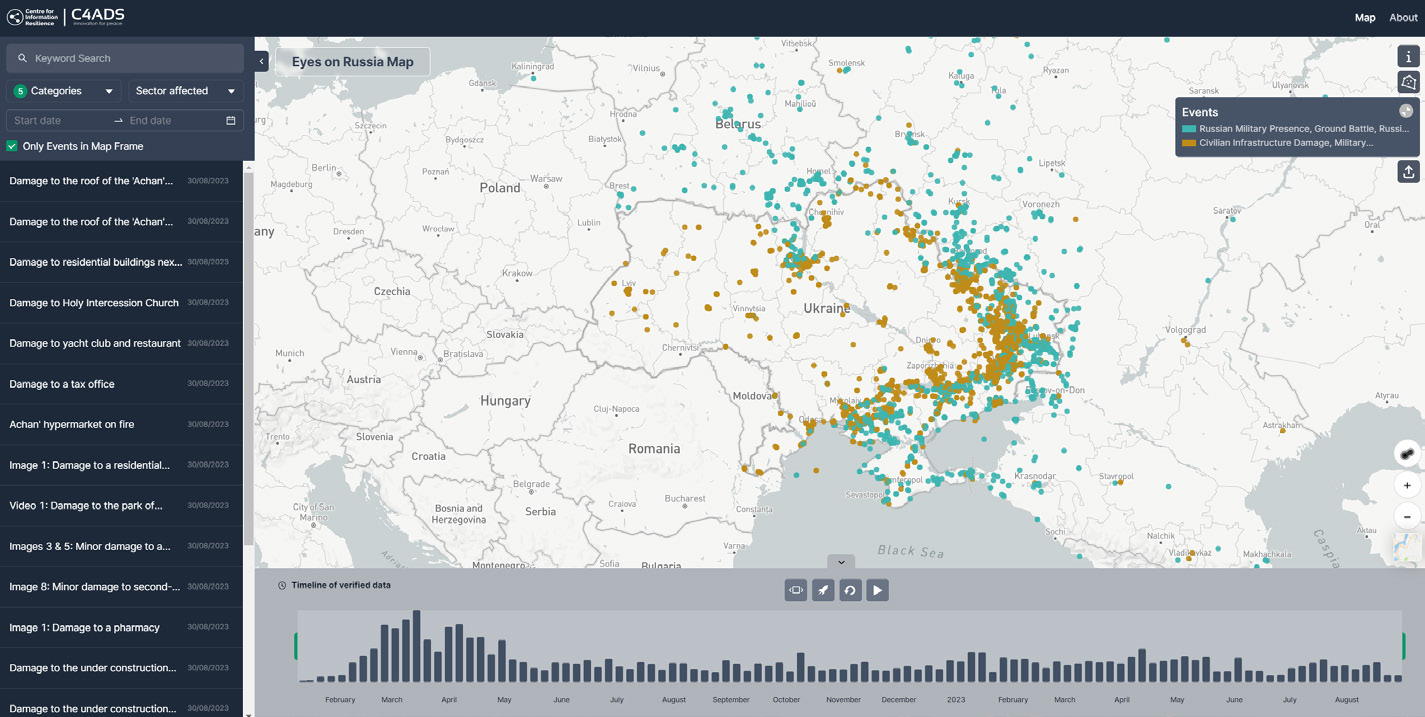
Figure 2
Earth’s examined platforms of low Earth orbit (LEO) satellites with their basic aspect and technical characteristics.
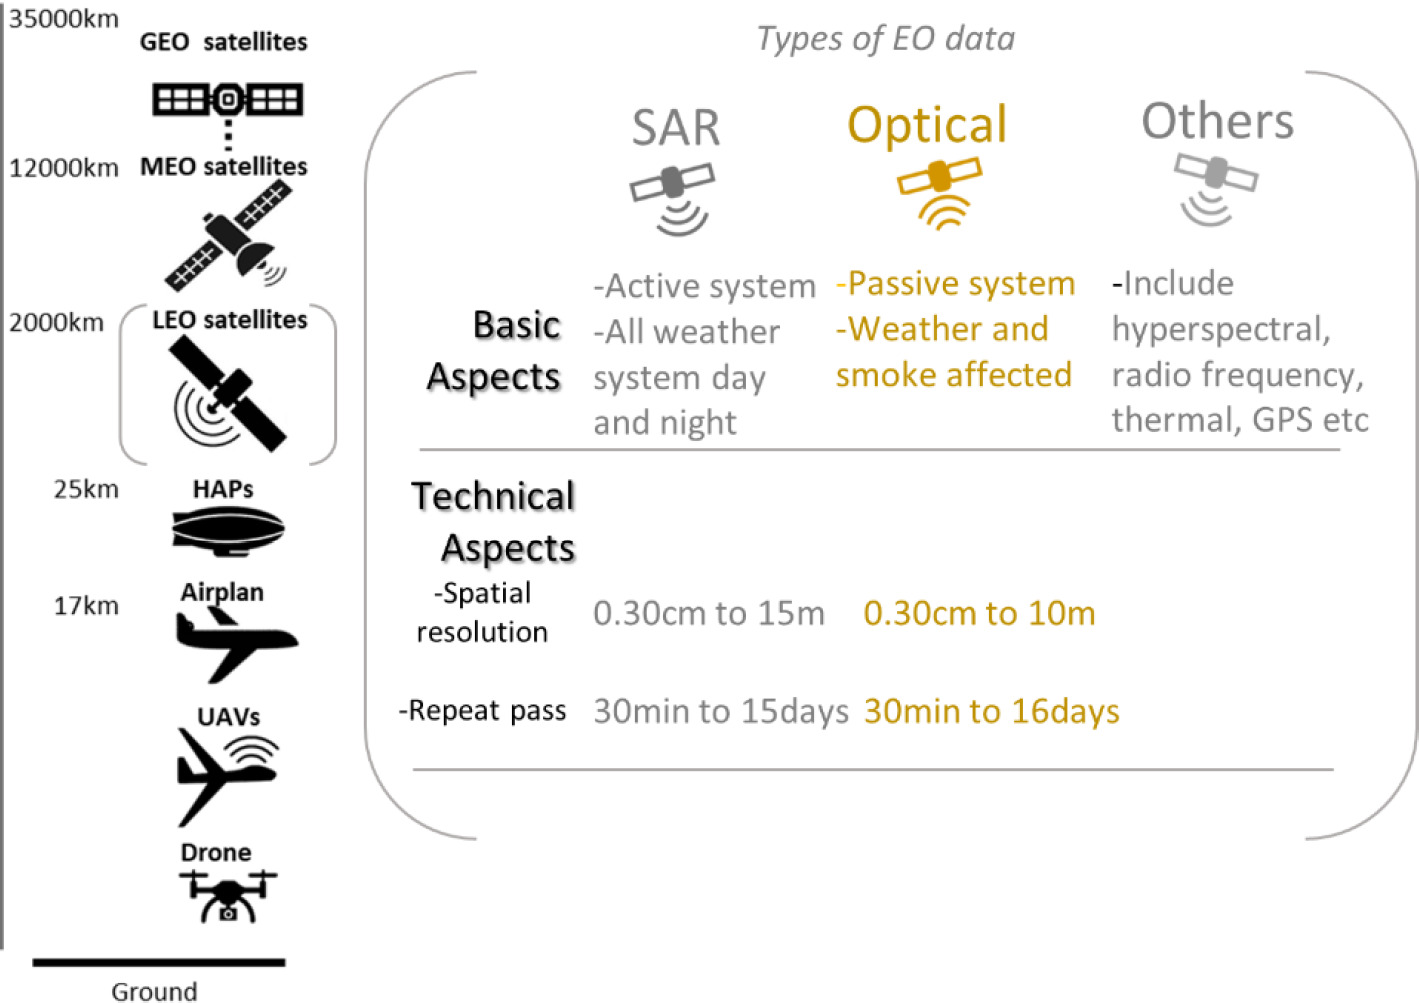
Figure 3
(a) Examples of optical and radar satellite solutions for observation by combining the spatial resolution and revisit time of satellite images with the spatial scale and temporal resolution. (b) A close-up view of imaging modes with a spatial resolution of less than 2 metres and a short revisit time. The panchromatic ground sample distance (GSD) is the spatial resolution of optical satellites. Notation: MR: medium resolution, HR: high resolution, VHR: very high resolution; satellites: CSK—COSMO-SkyMed; L—Landsat; TSX—TerraSAR-X; QB—QuickBird; S-1—Sentinel-1; S-2—Sentinel-2; WV—WorldView; acquisition modes: HI—Himage; HS—High Resolution Spotlight; IW—Interferometric Wide swath; PP—PingPong; SC—ScanSAR; SC WR—ScanSAR Wide Region; SC HR—ScanSAR Huge Region; SL—Spotlight; SM—Stripmap; ST—Staring Spotlight; WS—Wide ScanSAR (adapted from Tapete and Cigna, 2019).
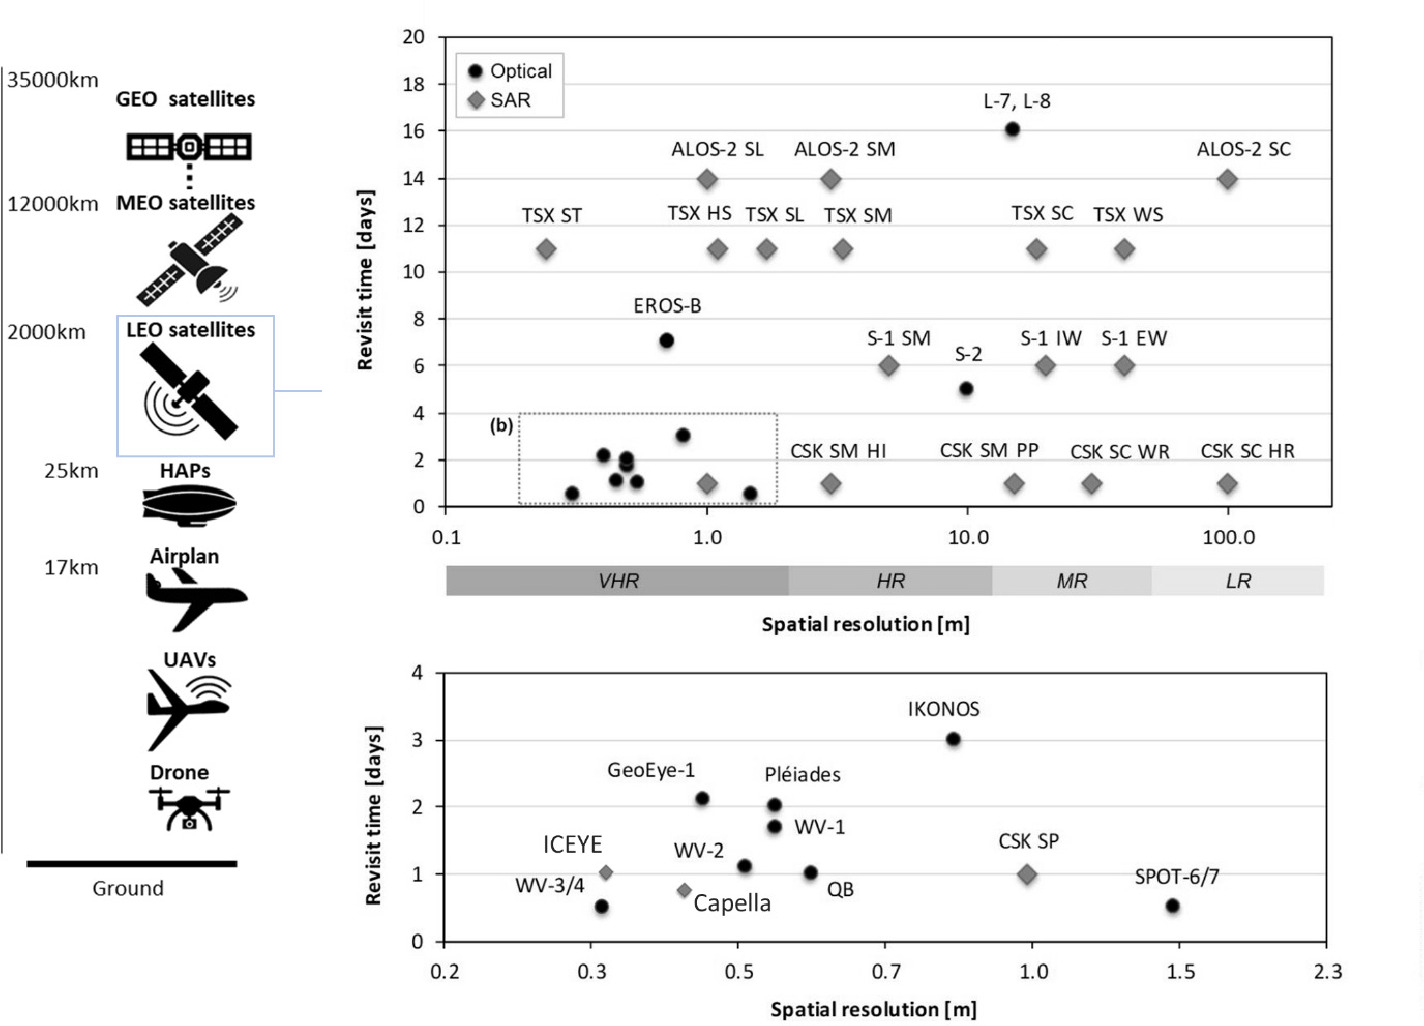
Figure 4
Social media prism. Media prism is a representation of social media channels and websites where the most relevant interactions are taking place today, as well as for the future, and the tools that are assisting in the generation and/or monitoring of social engagement around the world (adapted from Khan et al., 2016).
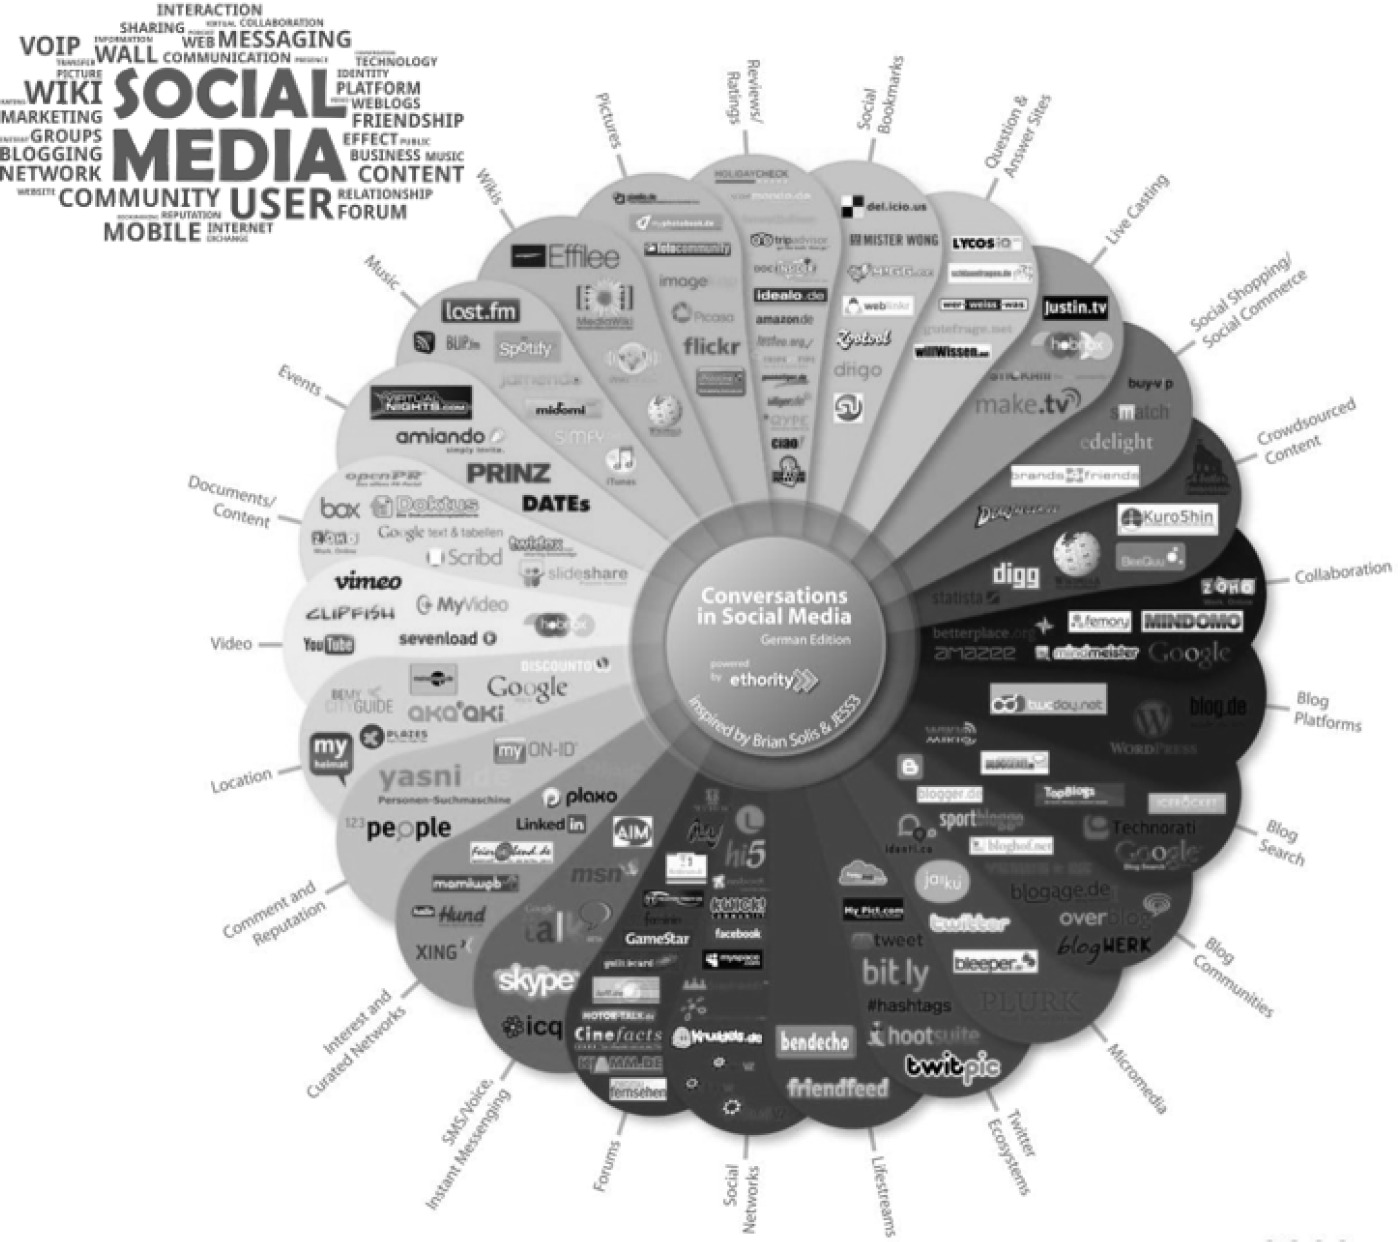
Figure 5
Our high-level architecture based on IMINT and GEOINT that integrates other added-value intelligence information.
Technically, anyone who knows how to use these tools and techniques to access information is said to have used this process. However, because these techniques are fluid due to technological changes, many of them cannot be carried out by anyone with knowledge.
Proposed high-level architecture
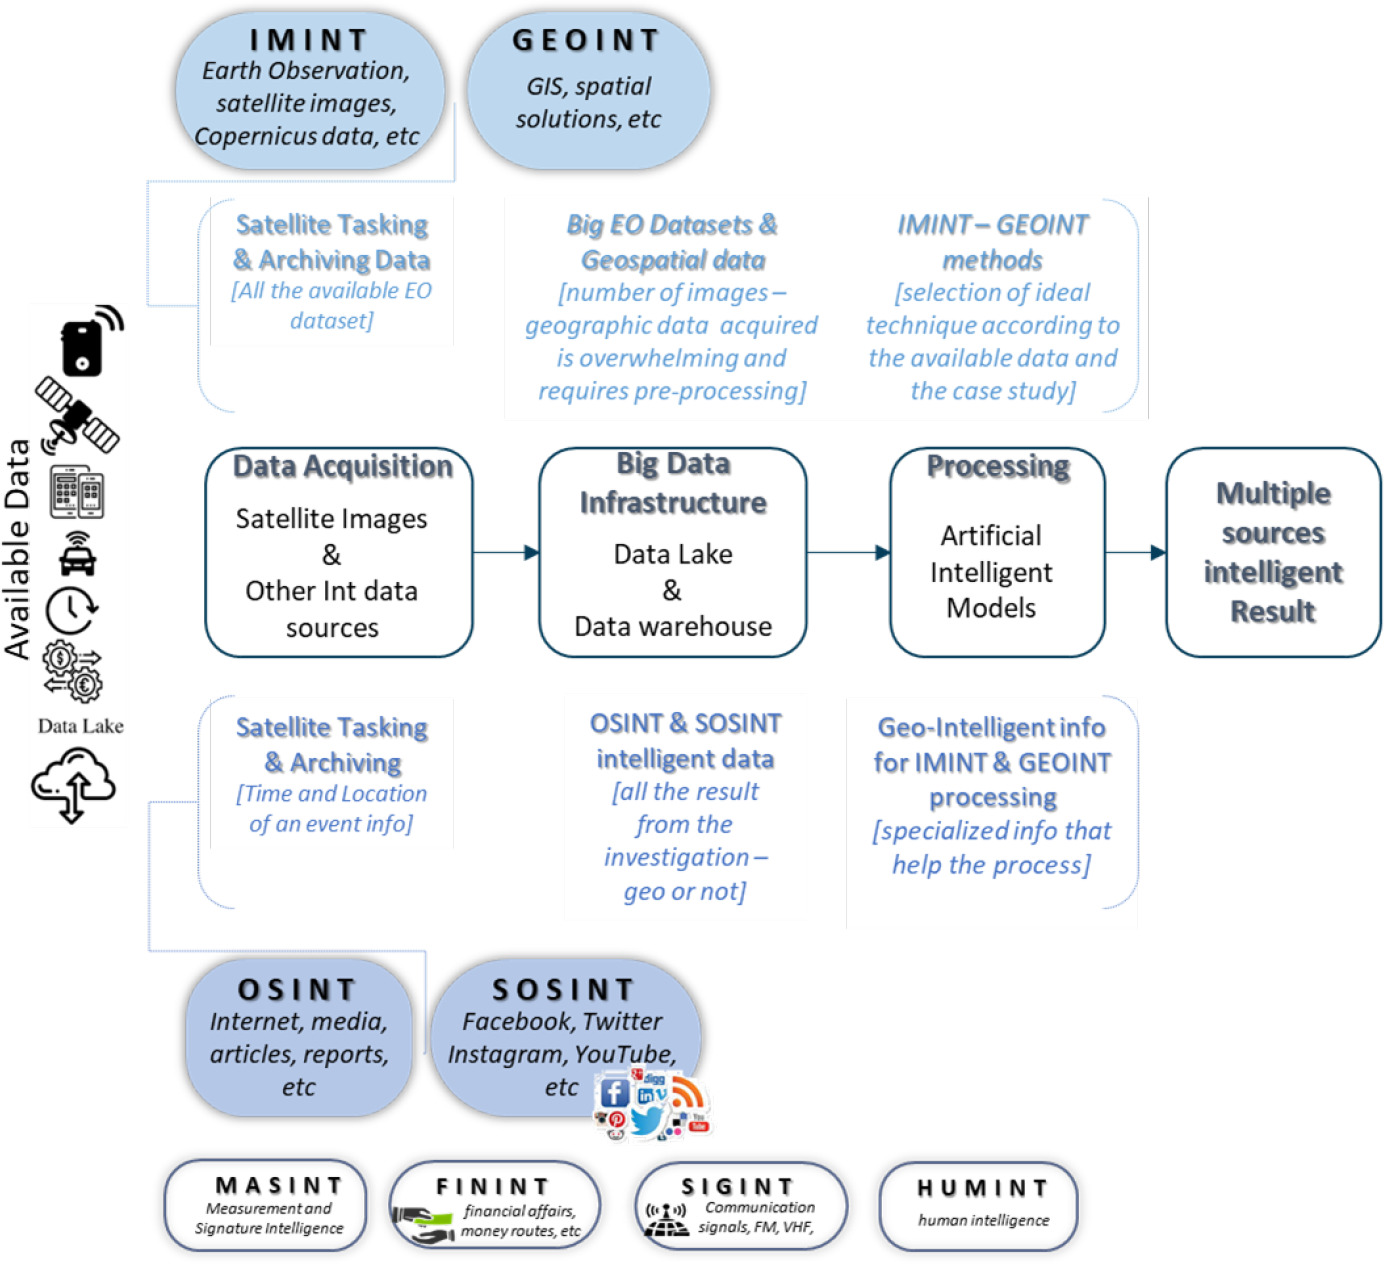
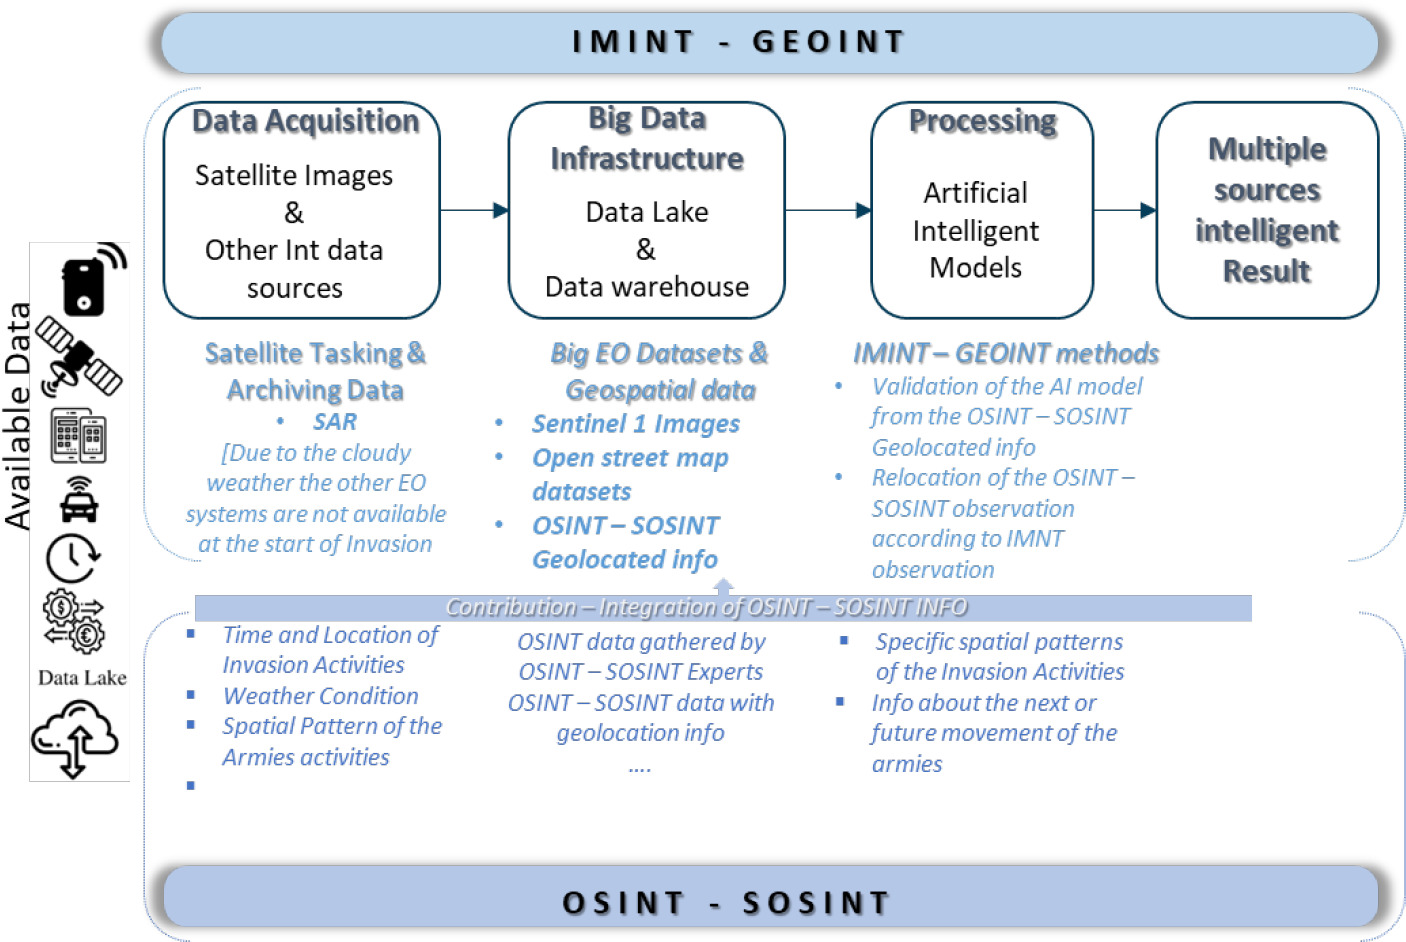
In this section, we present and discuss a high-level architecture based on IMINT and GEOINT using all the available geographic dataset (EO satellite images, geographical dataset, etc.) and state-of-the-art methods (machine learning [ML] and deep learning [DL]), integrated with added-value intelligence information from OSINT, SOSINT, and other INTs, creating multi-intelligent knowledge for security and defence decision makers.
Image and GEOINT are connected directly or indirectly. The information that is extracted from satellite images allows users to transform satellite imagery into common geospatial data, feeding map products and intelligence workflows. Geospatial intelligence is a discipline that involves the exploitation and analysis of imagery and geospatial data to characterise, evaluate, and visually display geographically referenced physical features and activities and spatial patterns on the Earth. GEOINT incorporates numerous disciplines, such as mapping, charting, and geolocated information, from OSINT or SOSINT, imaging analysis, and IMINT. The fundamental goal of IMINT and GEOINT is to organise and combine all available data based on their geographical position on the Earth, and then exploit it to create products that can be conveniently utilised by planners, emergency responders, and decision makers. Taking into consideration the aforementioned goal of IMINT and GEOINT, our high-level architecture schema integrates other added-value intelligence information from OSINT, SOSINT, and other available INTs to achieve the greatest possible accuracy.
Open-source information is gathered through OSINT and SOSINT. OSINT and SOSINT process collate and group all the available information into useful and actionable intelligence. Incorporating both internal and external assets into an OSINT scan for a large business can provide hundreds of thousands of results. All this information is gathered according to the type of case study and is accompanied by a specific geo-location in the real world. Most of the time, SOSINT initial sources (such as social media apps) use the location or geo-tagging location function, which is accompanied by a geolocation. If this is not the case, OSINT experts, with their knowledge of the field and their specific OSINT tools, are able to get the geolocation information in sufficient detail. This information can be valuable during all the stages of the IMINT and GEOINT analysis to improve the accuracy of the overall architecture.
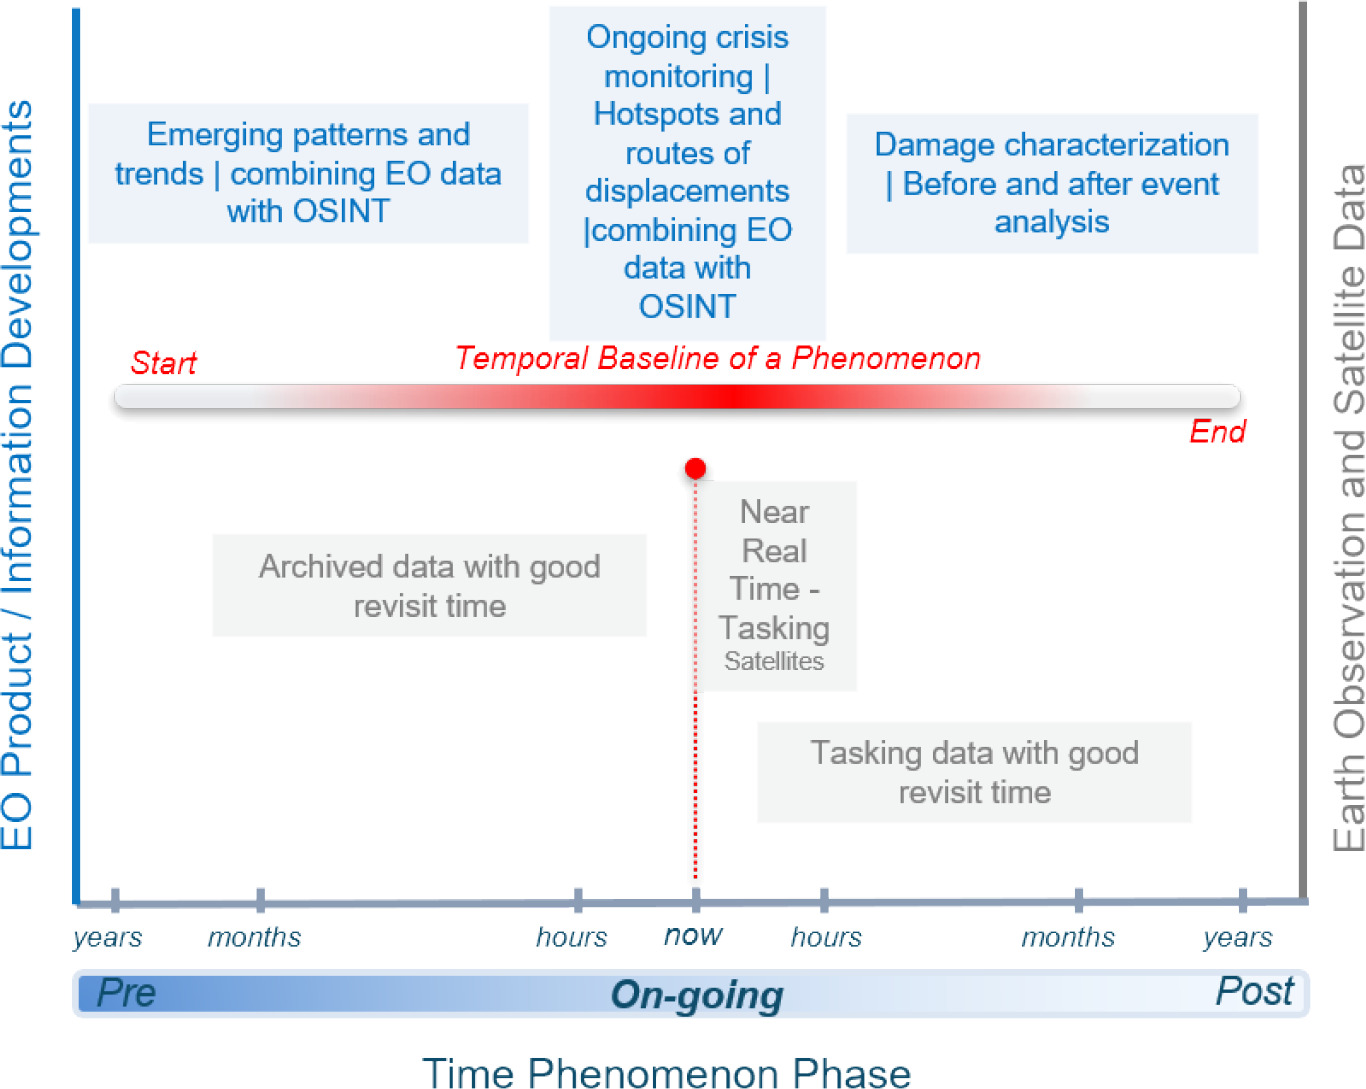
This high-level architecture shows the integration of OSINT and SOSINT to the IMINT–GEOINT pipeline. The fundamental idea is to use the added-value intelligence information from OSINT and SOSINT for all the IMINT–GEOINT pipeline stages and improve their accuracy and quality. For the data acquisition component from the IMINT–GEOINT aspect, the basic characteristic is the data availability. All the satellite systems have specific archive and tasking characteristics. EO and GIS experts search the available data according to the case study and its temporal baseline. The monitoring of a phenomenon can have three phases: the pre, the ongoing, and the post event. A case study can cover at least one or all these phases according to the type of the phenomenon or the characteristics of the observation. Most security and defence applications (and the most important from the end-user perspective) are located in near to real time and ongoing to the post-event, which is a very competitive environment. Because the pre-event is completely covered by all the existing and archived data from the existing satellite images. The satellite tasking capabilities and responsiveness for a specific area of interest are very important for the near-real-time and post-event case studies. The OSINT–SOSINT information can play a crucial role in the IMINT–GEOINT pipeline. It can rapidly highlight the area of interest and the timeframe of the event. More specific information that is gathered from OSINT–SOSINT about the case study, such as the specific time, the weather conditions, and the extent of the phenomenon, is very important. This information can specify the type of EO datasets that is optimal. These characteristics are very important inputs for the data acquisition component.
The EO services and products, as well as their technological developments, are clearly linked to the EO satellite datasets and their archive in the phenomenon’s temporal baseline (Figure 6). The more a phenomenon is activated or appears in near real time, the more the EO dataset should have the capability to observe it. If, on the other hand, the phenomenon appears in pre- or post-time, the EO dataset should be searched for archived or tasking data with a reasonable revisit time.
Figure 6
Relationship between EO products, information developments, and EO satellite data based on the observer phenomenon’s time baseline.
The next component is the data infrastructure, which consists of all the available datasets. Depending on the size of the application, it can be perceived that the size of the satellite datasets, the geographic datasets, and the gathered OSINT or SOSINT information is enormous. All these different types of datasets can be supported by a data lake or a data warehouse according to the needs of the application and the case study. The most commonly used data infrastructure for IMINT–GEOINT that is proper and more efficient for AI processes, such as ML and DL, is the Data Lake. A Data Lake could be defined as “a massive collection of data stored in its native format.” Data structure and processing only occur at the time of retrieval in Data Lakes. These are the repositories that contain data utilised for analysis tasks, such as AI and data visualisation. The other option is the data warehouse, “a data management system designed to hold vast amounts of pre-structured data from numerous sources.” Their objective is to collect and organise data through a precise classification method in order to rapidly give insights and enhance the business decision-making process. This implies that the purpose of data must be specified before it is loaded into the warehouse. Data warehouses have been used since the 1980s.
The most important component and the core of the proposed architecture is the processing of the data with state-of-the-art models to create an added-value multi-intelligence result in order to improve the quality and accuracy of decision-making for humanitarian support and situational awareness. Utilising innovative AI methods, exact and accurate data from satellite imagery over wide areas can be obtained. AI models are already very successful in many industries involving the acquisition of large amounts of visual data to aid in pattern recognition. AI can enhance the identification of objects, detection and monitoring of land use, data fusion, cloud removal, and spectral analysis of environmental changes from satellite or aerial imagery. Images acquired by satellites and the specific intelligent information of OSINT may give near real-time reports for huge regions with complicated feature distribution, such as in agriculture, urban planning, transportation, disaster management, climate change, and wildlife conservation applications. Using neural may help in data collection, processing, and comprehension, enabling data consumers to interpret and manage data more effectively and in a timelier way. The specific intelligent information of OSINT–SOSINT can be an added-value factor in the processing component. Characteristics such as the area of interest and temporal baseline of the event can affect the resources and the time needed for big data processing. OSINT–SOSINT data thus plays a major role in order to handle this issue. A specific characteristic that can be a label for AI techniques or whatever intelligent information may be considered important to feed the AI model could be provided by OSINT–SOSINT data. Among the most popular and used state-of-the-art AI models for defence and security applications using EO data are the object and change-detection algorithms.
Specific state-of-the-art AI object-detection algorithms
Locating and classifying objects of interest, a hot topic in remote sensing (RS) image analysis, is essential for object detection in remote sensing images. Numerous innovative and effective detection algorithms have been presented with the advancement of DL technology, which has accelerated in recent years. Overcoming the difficulty of object detection in computer vision has received a lot of attention recently. Contrary to image classification, object detection tasks inherited from classification tasks need the algorithm to not only determine the category to which an object of interest belongs but also to pinpoint the object’s position using a bounding box, which makes the task more challenging (Li et al., 2022).
Deep learning-based object-detection methods can be categorised in one-stage and two-stage object-detection algorithms (Figure 7), considering whether a step for the proposed region is included in the procedure. Two-stage algorithms provide advantages in terms of accuracy, since they add a step to the overall process, which is similar to an additional screening step on top of the first one. One detection is all that one-stage algorithms do; it is faster because the proposal region generating phase is not present (Li et al., 2022).
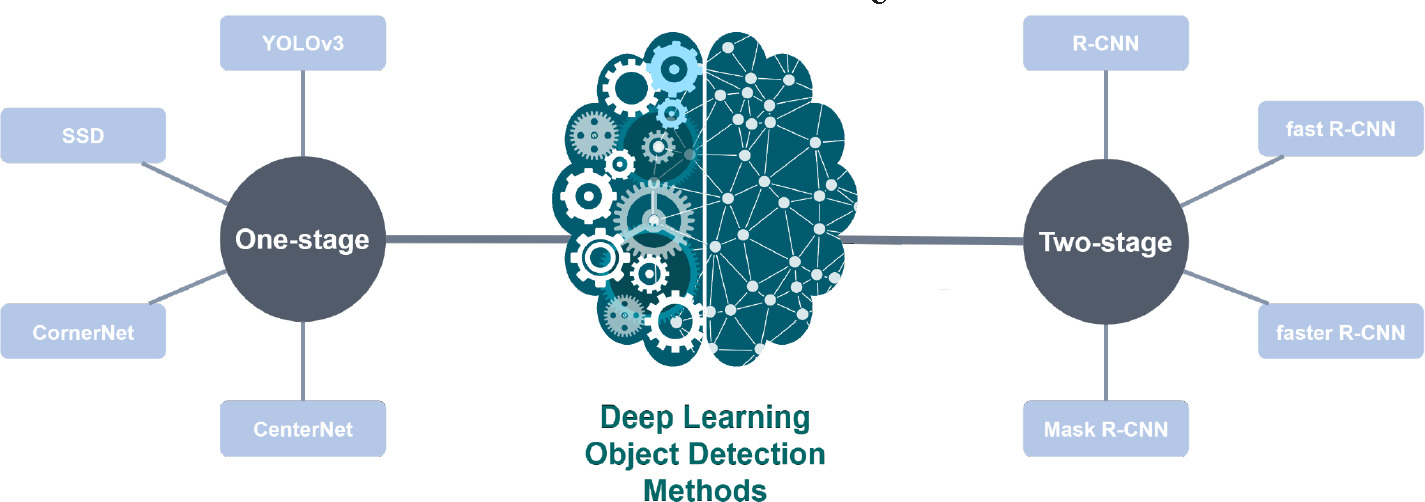
Two-stage algorithms include the R-CNN family, a collection of algorithms which are indicative of this approach. Specifically, R-CNN, fast R-CNN, and faster R-CNN belong to this category. On the other hand, one-stage algorithms include the YOLO, the SSD, and the anchor-free families (Li et al., 2022).
Specific state-of-the-art AI change-detection approaches
Change detection (CD) using remote sensing data is a popular approach for detecting changes on the Earth’s surface, with applications in urban planning, environmental monitoring, agriculture, disaster assessment, and map revision. The goal of change detection is to find pixels that have undergone “semantic change” in multi-temporal remote sensing images taken at different times and in the same location. Many factors can generate “semantic change,” including the object’s deformation, relative motion, appearance, or disappearance. Integrated AI technology has become focus of study in recent years when it comes to developing new change-detection methods. The AI model’s structure is complex and it must be well designed to fit various application scenarios and training data. Existing mature frameworks, such as TensorFlow, Keras, Pytorch, and Caffe, make the development, training, and deployment of AI models easier for researchers.
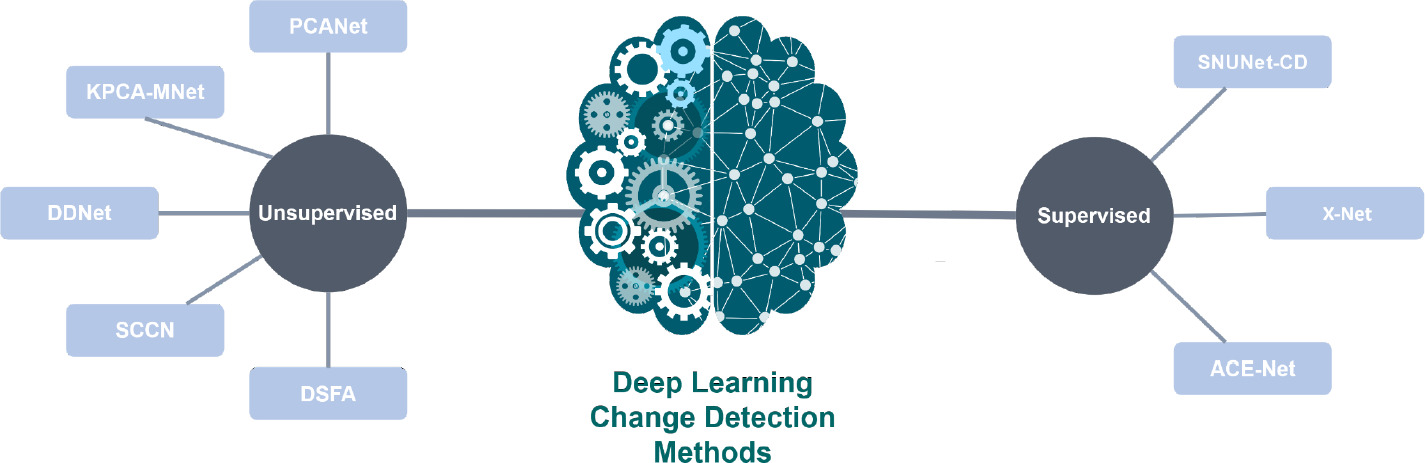
Supervised
Most of the existing change detection models based on DL require annotated training samples. SNUNet-CD, a densely connected siamese network for change detection of very high resolution (VHR) images, is proposed by Fang et al. (2022). The X-Net and the ACE-Net are two deep convolutional neural network architectures for heterogeneous change detection (Luppino et al., 2022).
Unsupervised
When the ground truth for supervised learning is not easily accessible, unsupervised change detection from remotely sensed images is a key option. Change detection in SAR images is a common procedure. Due to speckle noise and class imbalance (changed and unchanged), detecting small area changes with SAR data is a difficult process. Using DL techniques, a robust unsupervised approach for small area change detection is provided in the study of Zhang et al. (2021). Qu et al. (2022) proposed a dual-domain network; changed pixels identified as “1” and unmodified pixels marked as “0.” Based on hierarchical Fuzzy C-Means (FCM) clustering and PCANet, Gao et al. (2016) proposed a change-detection approach for SAR pictures. Based on heterogeneous SAR and optical images, Liu et al. (2018) suggested a new symmetric convolutional coupling network (SCCN) for change detection. SCCN is completely unsupervised, with no labelled pixels. In addition, a novel unsupervised technique for extracting representative features from multi-temporal VHR images, named kernel principal component analysis (KPCA), convolution was presented by Wu et al. (2021). Finally, for multi-temporal remote sensing images, a novel unsupervised change-detection approach, called deep slow feature analysis (DSFA), was proposed by Du et al. (2019).
Results
Ukraine case study
The high-level architecture with IMINT–GEOINT and the integration of OSINT and SOSINT was implemented at the start of Russia’s invasion of Ukraine (24 February 2022). The OSINT and SOSINT data provides insightful information about the first component (data acquisition). The weather conditions observed and mentioned in the OSINT and SOSINT sources were crucial. The bad weather and heavy cloud coverage over Ukraine became a problem for optical satellites that use visible, near-infrared, and short-wave infrared sensors to produce imagery. On the other hand, SAR satellites can also penetrate clouds and acquire images at night. The geolocated intelligent information defined the frame of the available data searching.
All the available datasets were collected to support the high-level architecture. The EO dataset for this case study was the European Copernicus’ SAR satellite Sentinel-1 (Copernicus Sentinel data, 2022). Sentinel-1 is a constellation of two imaging radar satellites operated by the European Space Agency (ESA). On the other hand, the OSINT data was extracted from an OSINT platform (Strick, 2023). This platform offers a curated collection of offline stored, evaluated, validated, classified, and labelled social media evidence. Following the filtering of the data from the platform, we only detected the cases that report infrastructure damage in our area of interest, including the cities of Hostomel, Irpin, Bucha, and Horenka.
Abnormal activities detection using a DL model on the InSAR coherence time series
We implement a novel approach to damage mapping that combines DL with an SAR time series dataset of a damaged location to extract abnormal changes in the Earth’s surface characteristics due to natural or man-made disasters.
The AI tool’s main goal is to improve the thematic and geometric level of information in the decision-making policies and plans of the agencies by minimising the time spent on security and defence plans. It will also assist authorities in detecting and monitoring the impact of unlawful actions such as war invasions, illegal immigration, and unusual activities and changes in the boundaries of a country. All of these spatiotemporal observations can help authorities and decision-making agencies in the security and defence sector develop the first impression of the scale of damages caused by a crisis event. This novel approach covers a big range of relevant applications, such as war invasions, border monitoring, and deterrence of illegal activities relevant to security and defence and also other domains, such as natural disaster monitoring. This tool can be used to monitor damaged locations, discovering abnormal changes in the AOI’s surface characteristics. The results can provide insight in order to generate a report for a damage assessment map or as ancillary datasets (e.g. obstacles, barriers, and prohibiting areas) for other procedures, such as supporting evacuation plans or other humanitarian activities.
Satellite remote sensing plays an increasing role in the rapid mapping of damage after natural or man-made disasters. In particular, the SAR data captures the Earth’s surface and, therefore, the damage to infrastructure. The SAR (active/radar) sensors work day and night as they don’t need solar illumination. They are also unaffected by weather conditions, since “the microwave passes the clouds.” They are, therefore, called “all weather systems.” The initial mapping of damages from the invasion activities are restricted to OSINT information. The optical EO data cannot observe the abnormal activities due to the cloudiness observed in the area.
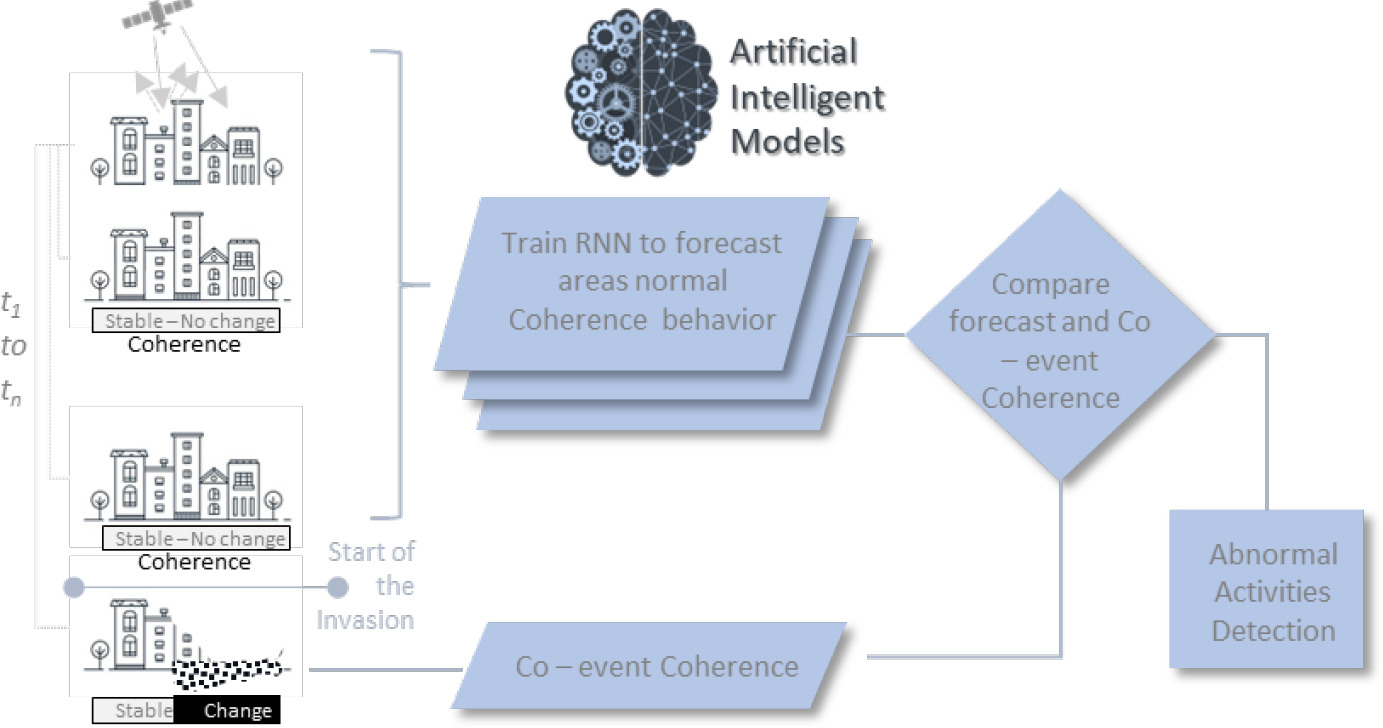
In our research, we investigate the implementation of a novel approach to damage mapping, combining DL with an SAR time series dataset of an impacted region in order to detect anomalous variations in the Earth’s surface properties due to a phenomenon. For this reason, we use a time series of interferometric SAR (InSAR) coherence data; then, we use a recurrent neural network (RNN) as a probabilistic anomaly detector on these coherence time series.
Recurrent neural networks are a type of DL architecture particularly well suited to dealing with sequential (time-ordered) data. The ability of RNNs to learn generalised rules from large time series data sets makes them a good candidate for application to large satellite time series observations, and RNNs have recently begun to be used on satellite data for tasks such as forecasting, classification, and anomaly detection (Alzubaidi et al., 2021).
The RNN is first trained on a pre-event coherence time series, and then forecasts a probability distribution of the coherence between pre- and post-event SAR images. The difference between the forecast and observed co-event coherence provides a measure of the confidence in the identification of damage. The method allows the user to choose a damage-detection threshold that is customised for each location, based on the local behaviour of coherence in the time before the event.
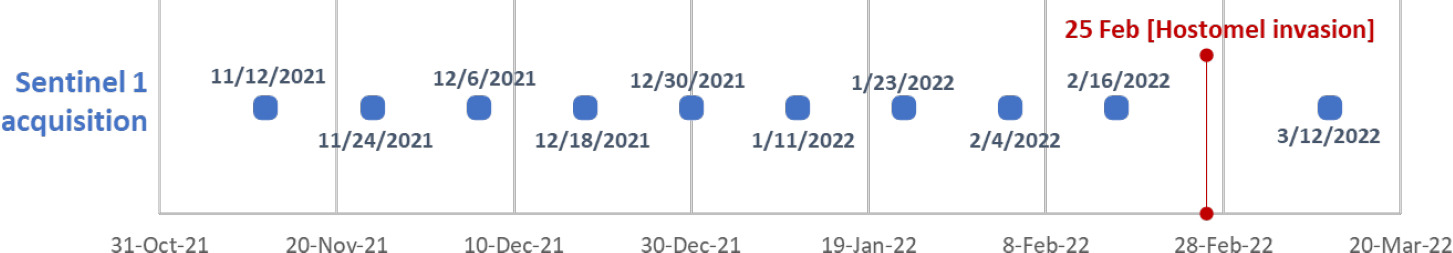
The temporal extent of the implemented approach is shown in Figure 11.
Study area and data
On 24 February 2022, Russia’s invasion of Ukraine escalated the Russo-Ukrainian War, which began in 2014. Since World War II, it is the largest conventional military strike in Europe. The Russian invasion in Ukraine is the first conflict in history to be followed, and almost broadcast live, with near-real-time datasets, thanks to GEOINT and OSINT. Analysts are pouring through Twitter, TikTok, Facebook, and other social media feeds to offer real-time analysis of the developments on ground. Through analysis of posted images and videos, and even Google Maps data, OSINT researchers are trying to understand what is happening inside and close to Ukraine’s borders.
The proposed methodology will contribute to the challenges associated with enhancing law-enforcement agencies’ decision-making processes. It will facilitate access to sophisticated satellite-derived information, which is very important in law-enforcement tasks. The satellite images and their spatiotemporal characteristics, combined with the interactive AI tool, give authorities the capability to match their agencies’ decision-making needs, providing vital intelligence and decision-making information. The outcomes from this methodology will be able to support the strategic plans of these agencies. The abnormal activity monitoring of an area will be able to highlight the location of the probable abnormal activities. The level of the changes and the spatial extent of the same will also give a damage proxy map for these changes. These IMINT observations will be very helpful with the combination of other techniques (OSINT, GEOINT, etc.) to verify the location of these activities. The fusion of these results is able to support the agencies with a first impression report through a damage proxy map. Finally, these outcomes will be able to be used as ancillary datasets (e.g. obstacles, barriers, and prohibiting areas) for other procedures such as supporting evacuation plans or other humanitarian activities.
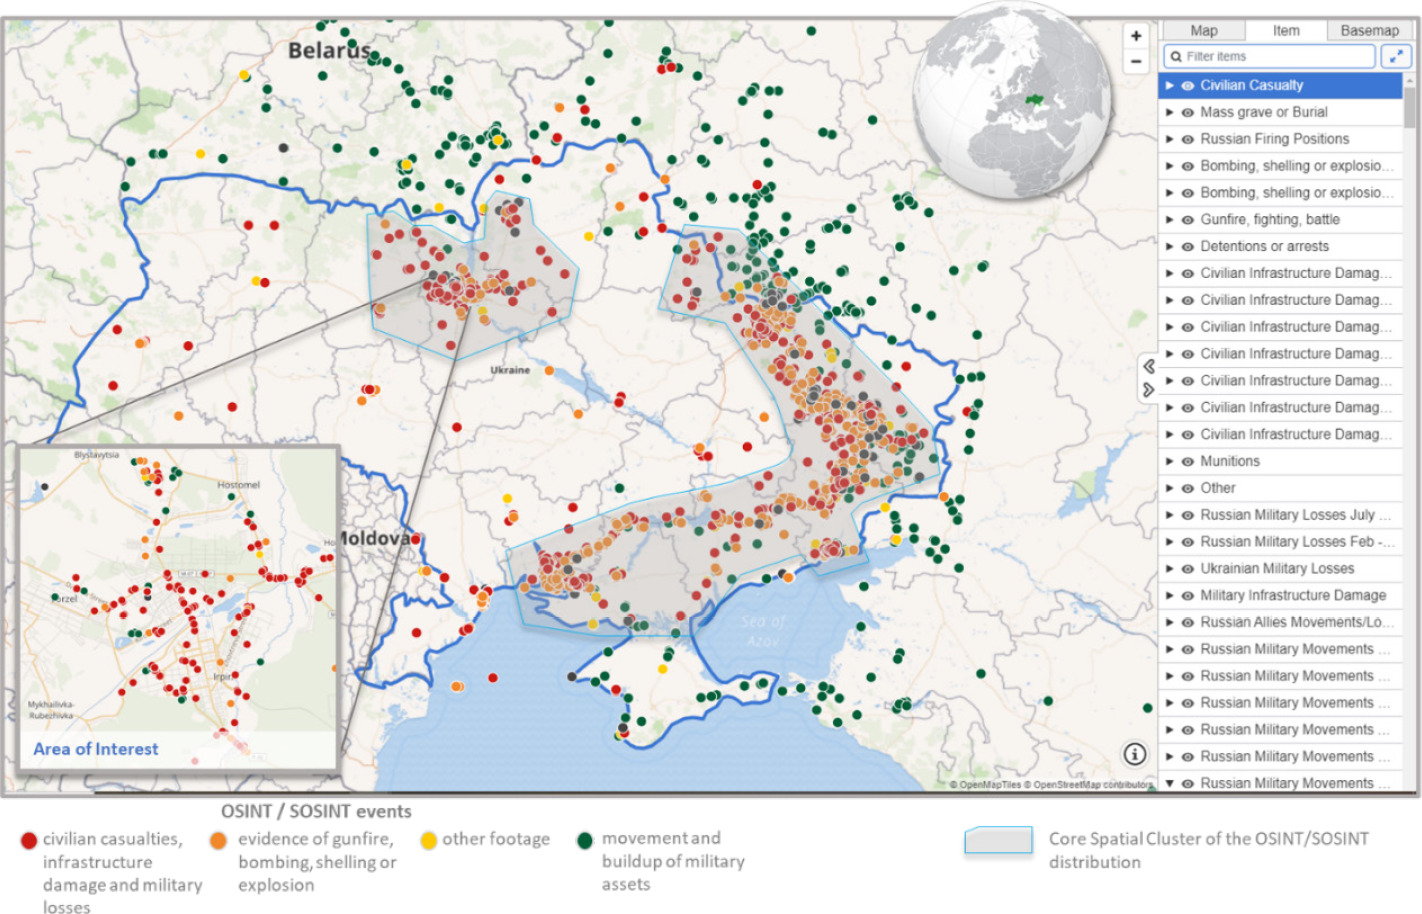
For the purpose of this study, a Copernicus Sentinel-1 coherence dataset will be used. The spatial extent of the study area is shown on the map in Figure 12. It is located northwest of the capital city of Kyiv, Ukraine. It includes the cities of Irpin, Bucha, and Hostomel. Using this approach, 10 Sentinel-1 SLC images were obtained. The criteria for the selection of scenes were the high quality of data.
Figure 12
Map of the area of interest and the broader map of the OSINT–SOSINT events with red marking civilian casualties, infrastructure damage, and military losses, orange marking the evidence of gunfire bombing, shelling, or exploration, yellow marking all other footage, and green marking the military movements. The blue transparent polygon is the core spatial distribution of an OSINT–SOSINT event that was used for the satellite archive selection. The background is from the online map of the Centre for Information Resilience’s Eyes on Russia project (adapted from Strick, 2023).
The results depict a harmonious collaboration between IMINT–GEOINT and OSINT–SOSINT. The detection of abnormal activity using a DL model on the InSAR coherence time series provides the first reconnaissance of the area as well as the damage proxy map after the invasion. The spatial patterns of the damage proxy observations show a similar spatial distribution to the SOSINT geolocated information. Specifically, the IMINT damage proxy products with the DL coherence time series observations accurately highlight the locations of the SOSINT geolocated information. The proposed methodology managed to overcome all the used case disadvantages (such as the cloudy weather and the data availability) and observed the location of the abnormal activities and their damage proxy extent with very good responsiveness. It is very important to highlight that the optical satellite images allowed us to observe the same spot after 2 weeks (when the weather conditions were better). The algorithm of abnormal activity detection provides robust results.
Focusing on the damage proxy scores, we noticed five areas of interest that show interesting spatial patterns, and they are matched with the OSINT and SOSINT geolocated datasets. The first one is the Antonov International Airport (Figure 13A), near Kyiv, where the DL algorithm observed two cases: the destroyed toll booth and an Antonov AN-225 airplane, and the destroyed fuel depot in the southeastern part of the airport.
Figure 13
The overview map with the IMINT results and the five areas of interest that show interesting spatial patterns and are correlated with the OSINT–SOSINT geolocated datasets.
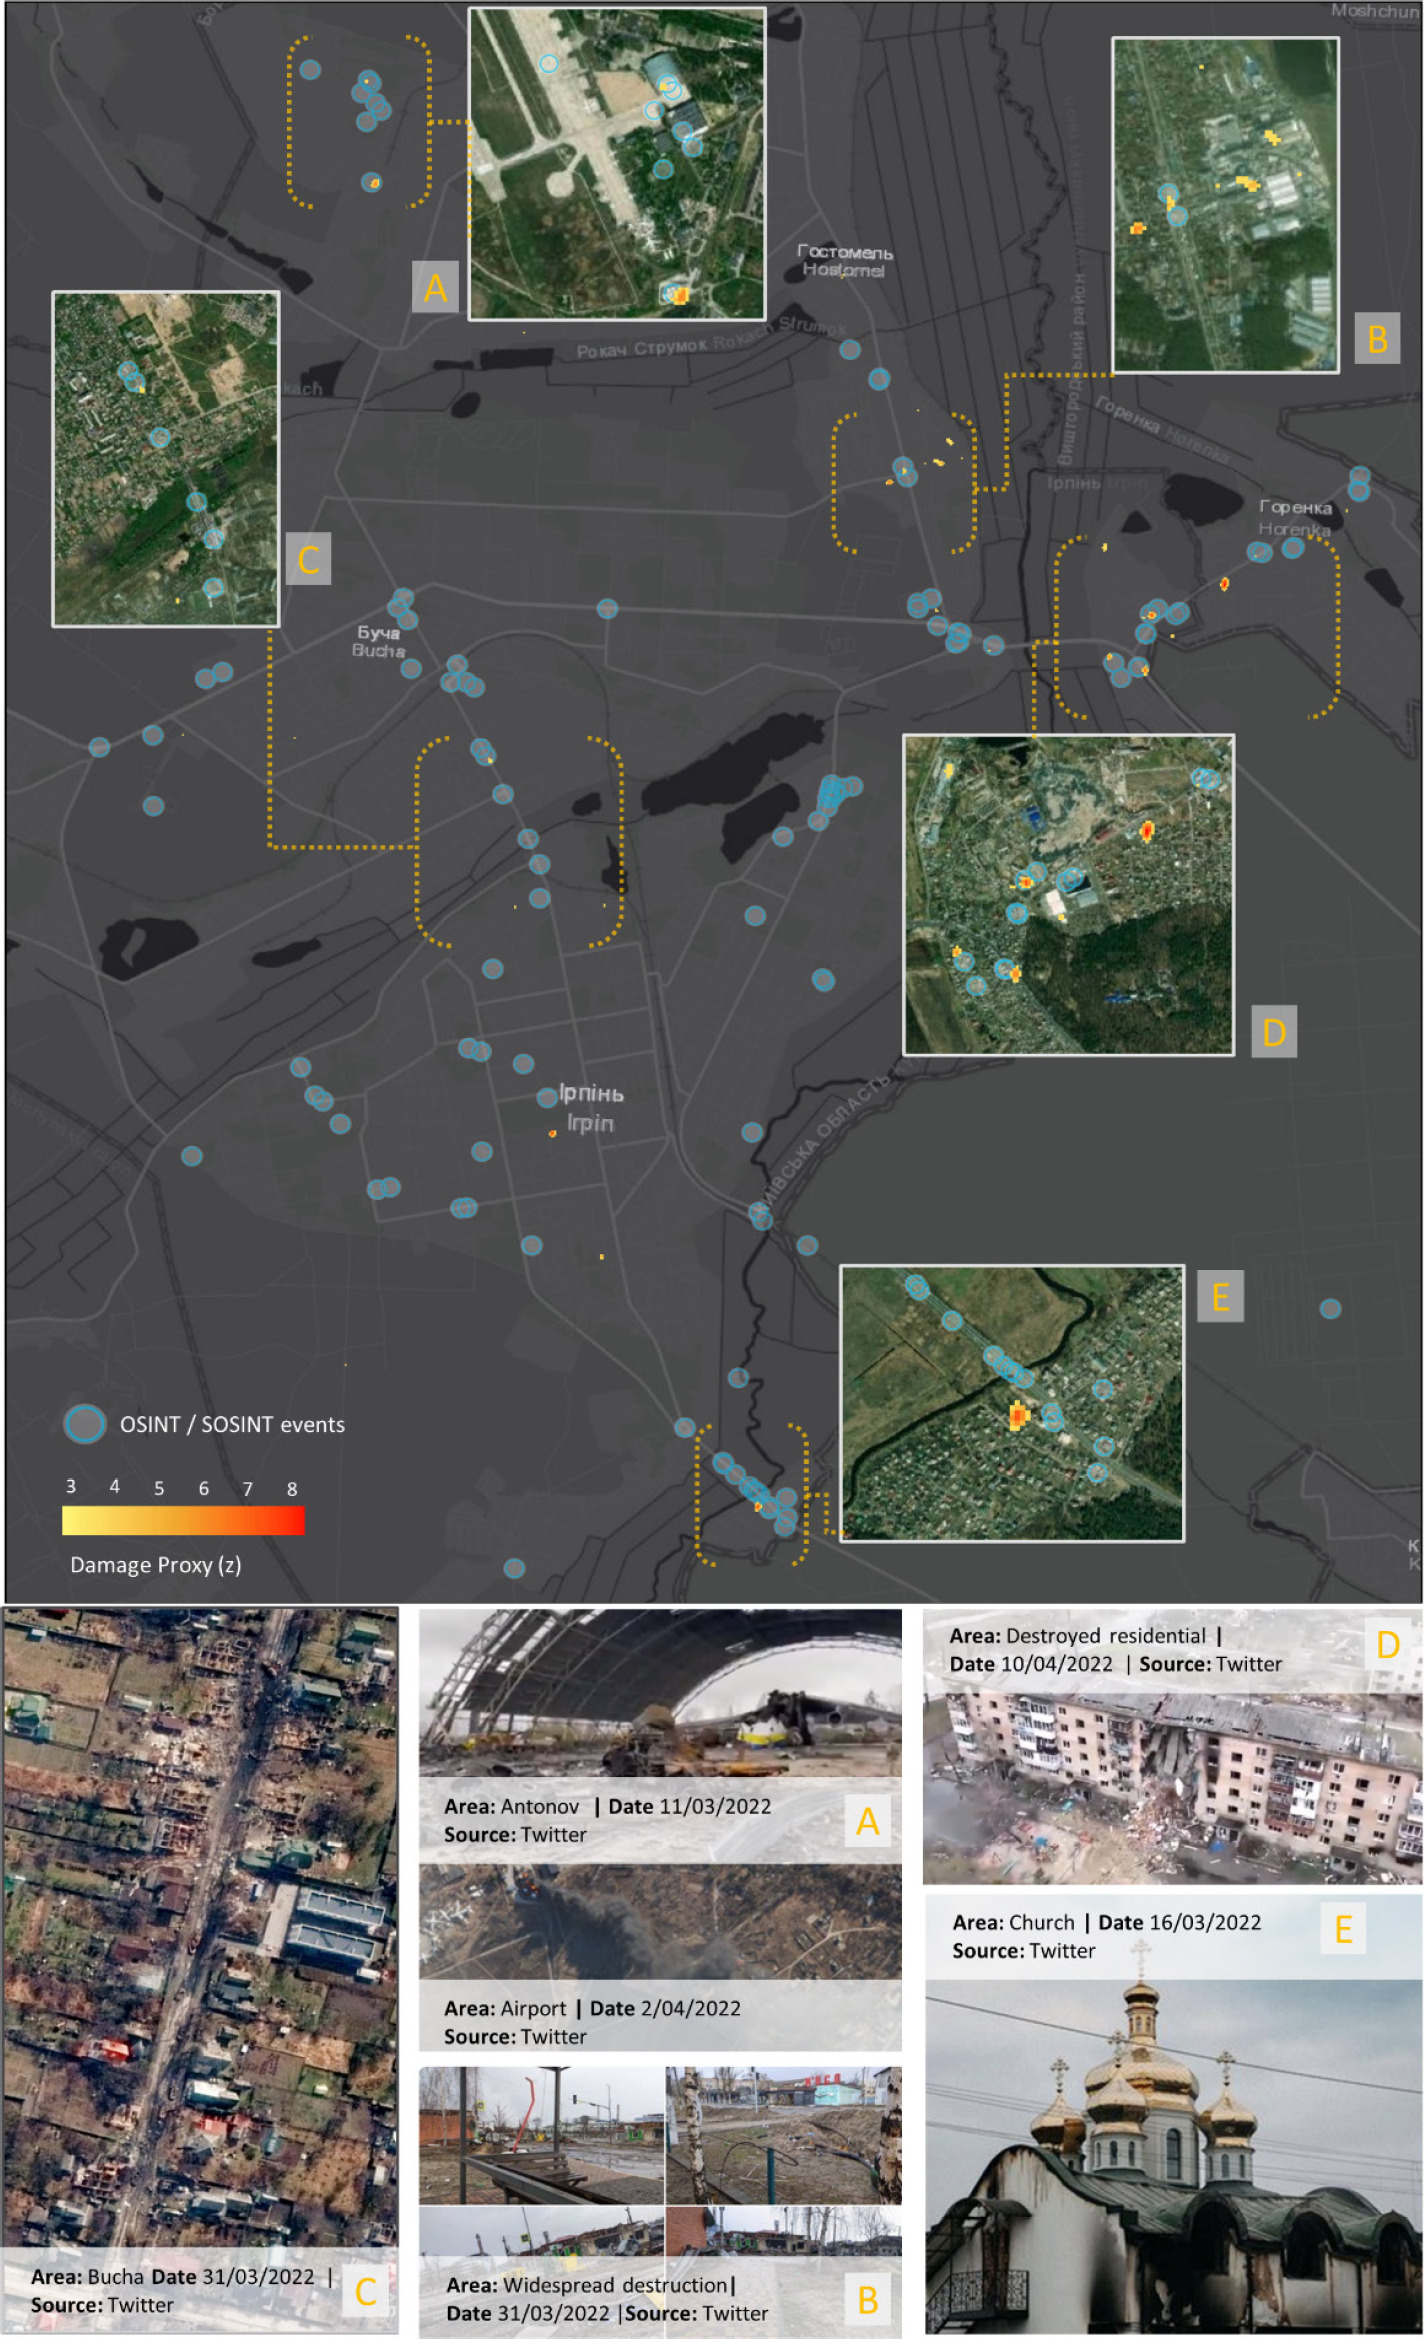
Figure 14
The map of the five areas of interest that show interesting spatial patterns with high damage proxy scores and are correlated with the OSINT–SOSINT geolocated datasets. Area A is the Antonov International Airport, area B is Sviato-Pokrovska street in Hostomel, area C is Vokzalna Street in Bucha, area D is the residential block in Horenka, and area E is the Irpin Orthodox church.
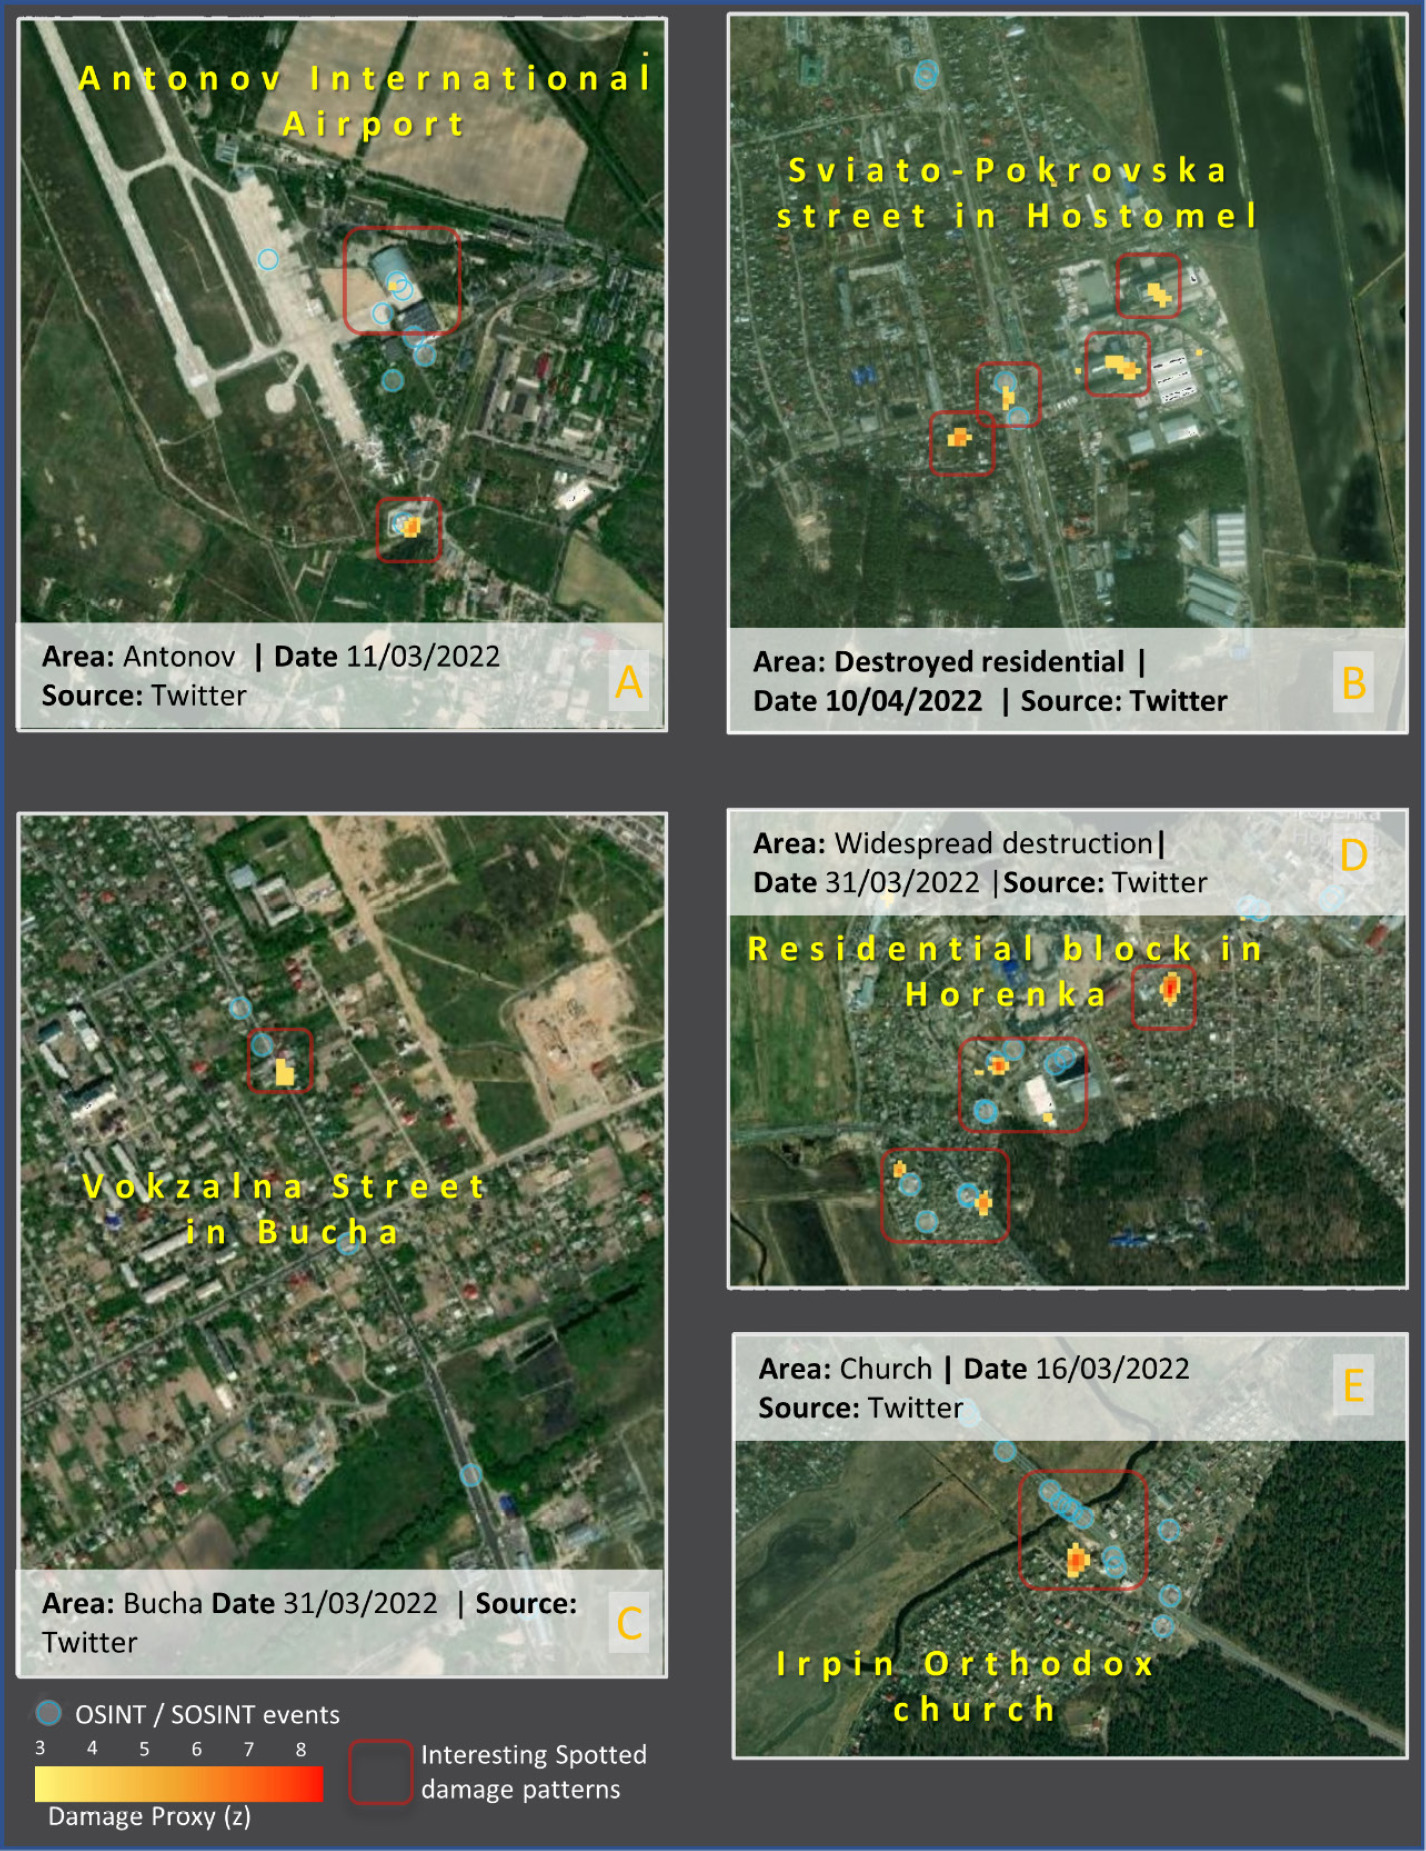
The second area of interest is on Sviato-Pokrovska Street in Hostomel (Figure 13B). The OSINT–SOSINT shows Ukrainian forces destroying four armoured vehicles, one of which was carrying a number of dead Russian servicemen, near Vetropak Hostomel’skyy Sklozavod. The damage is extensive and observed from the IMINT procedure. The Russian air attack at the same time also caused damage to industries in the east, and the damage was spread out over a large area.
Another area of interest was the extensive damage to civilian infrastructure seen on Vokzalna Street in Bucha, to the northwest of Kyiv (Figure 13C). The damage was very localised, but the geolocated OSINT and SOSINT data highlights the abnormal activity. The images from SOSINT showed numerous destroyed military vehicles and surrounding residential areas.
The fourth observed area is a residential block in Horenka (Figure 13D). OSINT–SOSINT geolocated datasets showed that there were many damaged warehouses in this area. The IMINT approach also detected three clusters with high scores for proxy damage.
The last notable area of interest was the area around Irpin’s Orthodox Church (Figure 13E). In this case, OSINT–SOSINT reported civilian casualties after a Russian strike. The damage was very extensive, as observed from the IMINT procedure. Unfortunately, here, the IMINT algorithm does not detect the destroyed bridge near the area after the strike attack.
Discussion
The fusion of EO and OSINT analysis proved to be very effective and provided extremely useful insights. In particular, through the proposed methodological framework, we managed to detect airfield destruction (buildings and fuel storage tanks) as a result of the Russian invasion in Hostomel, the much-discussed incident involving the destroyed Antonov airplane at the International Airport, a damaged Cathedral in Irpin as a result of Russian shelling, and heavily destroyed residential blocks. All these events were verified with the results from OSINT analysis, which highlights the validity of the implemented approach.
One of the positive impacts of this approach is the fast and automatic processing of tasks due to the algorithmic efficiency, optimisation operations, and processing resources. The quick generation of the information layer from our methodology could be very important in time-critical applications and decision-making. Another benefit is the promising integration of the results in operational workflows. Potential users could integrate the proposed pipeline at the start of their workflow (investigation prior to field operations) in order to gain a first impression of the event of interest. In addition, the proposed pipeline could be integrated during the last steps of their workflow (event monitoring) in order to study and cross validate the results. Another advantage of this robust and adjustable approach is the ability to generate results everywhere around the globe for events that happen in the present or have happened in the past.
A key “barrier” is the absence of “automatic” reasoning over the extracted relationships between information from EO and OSINT analysis. The machine-based nature of the results should be considered and the role of the end-user should be delineated. Based on our performed case studies, we believe that the role of the end-user is indispensable (human-in-the-loop). The approach should be centred on the expert knowledge and not only use it as an algorithmic input or algorithmic validation asset.
It is crucial to provide products promptly, ideally within hours, when using damage mapping for rapid response. Although it may take up to 6 days for a Sentinel-1 post-event acquisition, in many circumstances we will already have an image, enabling a quick disaster response. Although other SAR satellites also collect data, they don’t have the same extensive archive of open access acquisitions as Sentinel-1. Thus, the near real-time deployment of the proposed solution is of utmost importance. Such a deployment, which ideally is almost entirely automated, could follow the workflow shown below—determination of the phenomenon, identification of the SAR satellite that will pass over the impacted area in the near future and has a long enough history of observations, processing the downloaded data, implementation of the Deep Neural Network (DNN) model to predict the co-event coherence. Acquire the first available post-event acquisition and determine the coherence of the co-event, compare the latter with the forecast to compute the damage proxy map, and finally study this map and deliver it to the authorities of interest, ensuring that they are completely aware of the information that this product provides.
The outcomes in terms of responsiveness and quality of high-level architectures, such as our approach, can aid in the prevention of hybrid warfare actions. The examination of the conflict in Ukraine must be approached from both a military and a communication strategy perspective, where propaganda and deception have evolved into potent tools in contemporary tactics. With the available and proper acquisitions of EO satellite systems (with near real-time datasets), this architecture could enlighten the true situation and the spatial behaviour of the communication strategy perspective, such as propaganda and deception, with very good responsiveness.
The results of this work logic could offer added-value information to non-governmental organisations (NGOs) in humanitarian support by elaborating on the unique challenges faced by NGOs in providing humanitarian support, such as the need for timely and accurate information, understanding the dynamics of conflict zones or disaster areas, and the importance of monitoring and assessing critical infrastructure and affected populations. Furthermore, with regard to the decision-making procedures, the proposed high-level architecture and multi-intelligent knowledge from various intelligence sources can specifically support decision-making processes within NGOs. For example, the integration of IMINT, GEOINT, and OSINT could enhance the accuracy and quality of information needed for resource allocation, risk assessment, and response planning in humanitarian crises.
Conclusions
The paper recognizes the importance of utilising intelligence methods such as IMINT, GEOINT, and OSINT, along with AI/ML algorithms and EO data, to improve decision-making in humanitarian support and situational awareness. We believe that using EO SAR and optical images along with AI/ML algorithms is the ideal way to monitor numerous different sites over extended periods, send out alerts about abnormal activity, and detect potential new hotspots for military activity.
While the specific episodes of the Ukrainian conflict are briefly discussed in the results section, they serve as illustrative examples of how integrated intelligence can be applied in real-world scenarios. By analysing the abnormal activity detection, damage proxy mapping, and spatial distribution of observed damage, we aim to demonstrate the potential of using EO data and AI/ML algorithms to monitor conflict zones and provide timely information for humanitarian response. The ultimate goal of our research is to contribute to the development of tools and methodologies that can assist NGOs in their humanitarian efforts. By leveraging the power of integrated intelligence, we believe that NGOs can benefit from enhanced situational awareness, improved resource allocation, and more effective response-planning in crisis situations.
The proposed approach could be enriched with the addition of data and information gathered by other intelligence disciplines. The availability of EO satellite imagery for the area of interest could be challenging in some areas as which means the images are not usable. An important aspect that always has to be taken into consideration is the probability of detecting false positives that have nothing to do with the phenomenon under investigation but come from different sources.
The next step for the proposed architecture is to expand an automatic pipeline that will be able to integrate all of the available EO satellite image data providers and, using proper state-of-the-art ML/DL algorithms from EO experts according to observed phenomenon, will be able to give a simple representation of the observations through a predefined template. This huge volume of information with complicated algorithms will be run in a back-end system, and a friendly user interface template will present the observations for either expert or non-expert users.
The integrated approach described in the paper recognises the value of each intelligence source and the potential insights they can offer. It does not assume that all agencies or situations require the same set of intelligence. Rather, it highlights the benefits of harnessing the power of EO data along with diverse intelligence sources to enhance decision-making processes. This approach allows a holistic understanding of the situation, providing valuable information for military, political decision makers, NGOs, and other relevant stakeholders.