
Introduction
Drinking water networks and joint facilities are among the most important and highly valuable critical infrastructures. The collapse or malfunction of public utilities for energy transportation (electricity, gas, oil, etc.) and communication can have immediate and highly expensive consequences and, as a result, they are rigorously maintained and guarded. On the other hand, the vulnerability of a drinking water distribution network itself can be easily underestimated after long years of operation without serious emergencies. In reality, hundreds of thousands kilometres of pipes, i.e. 66 799 km in Hungary in 2020, are only a few metres below ground according to the Hungarian Central Statistical Office (KSH, 2020) and, because of automatisation trends, most of their joint facilities are unmanned.
In Europe, water utility companies usually need to employ operating staff to deal with the majority of possible failures, as required by laws and regulations. Protocols for local extreme emergencies exist, but they only include necessary measures needed to be taken until regular service is restored (usually this means water supply from mobile tankers). On the other hand, there is no accepted strategy for severe emergencies, when the numbers or the severity of failures exceeds not only the capacity of water utility companies, but the resources of the state as well.
As drinking water scarcity is a major problem in different regions of the world and water supply is disrupted by natural disasters, social tensions, or military and non-military conflicts, it becomes increasingly important for organised states to improve their ability to respond to challenges presented by drinking water distribution in small and large settlements. This study outlines how analyses using GIS (Geospatial Infromation Systems) and network hydraulics calculations can be used to mitigate the adverse effects a drinking water distribution network may be subjected to.
The main questions to be investigated are what uncertainty factors are present during the simulation and calculation of simple contaminant transport on the network, what the distance is that a contamination from a consumption point can spread and what parameters can aid in the detection and localisation of the source. Another goal is to illustrate that GIS and hydrauic simulation tools can be used to plan in advance for emergencies, e.g. the destruction of a portion of the network, and that the simulation may even be used to train regular and provisonal operating staff for such unexpected situations.
In the first part of the article, the data available and processing methods for hydraulic and water quality calculations are briefly introcuced, along with problems to be overcome. Based on previously calibrated and validated case study data, open source software is used to examine the case of contamination from consumption points and how to localise and stop the spread of contamination in the network. Other possible applications, such as physical destruction, are discussed with regard to how dynamic hydraulic calculations can be effectively used to find the best point of intervention in order to restore water supply. Finally, a tool for training is suggested which uses hydrulic simulation and may be used to train a significant number of personnel who are able to take over some critical opertional tasks, even if an extremely large number of regular operators are incapacitated.
Available data
The data required to create a mathematical model concerning the hydraulics of a drinking water distribution system on a computer is readily available in most cases. In Hungary, the almost complete geospatial data for all public utilities is stored in a state-owned database, and digital maps of the pipe networks are available at water supply companies. The calibration and validation of the simulation, on the other hand, presents some serious issues, which may add an unacceptable uncertainty to the calculated results.
Since the introduction of the Cross method in 1936, drinking water distribution networks could have been treated as graphs containing nodes interconnected by edges (Cross, 1936, p. 7). Other important facilities, e.g. storage tanks, valves, and pumps, can also be represented by nodes and edges, but their mathematical representation varies from software to software. Various mathematical solutions (Duzinkiewicz and Ciminski, 2006, pp. 247–249; Creaco and Franchini, 2014, pp. 313–321) have been published and used as computer programs for a long time to calculate hydraulic parameters of interest, namely the headloss along pipes, flowrates and material transport with chemical reactions. It should also be noted that there is no standardised and legally obligatory methodologies for network hydraulic calculations, but an extensive number of different case studies are available in the literature (Ben-Daoud et al., 2020; Kourbasis et al., 2020; Mentes et al., 2020).
The main issue in model creation is not the establishment of network geometry, which usually can be readily generated from the available geospatial data, but the acquisition of data which can be used as boundary conditions for calibration and validation. Even though nearly all of our drinking water distribution systems are equipped with SCADA (Supervisory Control and Data Acquisition System), the points where pressure and flow transmitters are installed have usually been determined by administrative boundaries, rather than technological data collection demands. Because of this, especially on large regional networks, degrees of freedom may not allow to validate and calculate the system, due to the lack of measured data. On the other hand, distribution networks of smaller settlements with only a few fixed pressure and flow boundary conditions can be validated and simulated easily and this is where simulation can be put to the best use when we aim to utilise it for emergency handling and training.
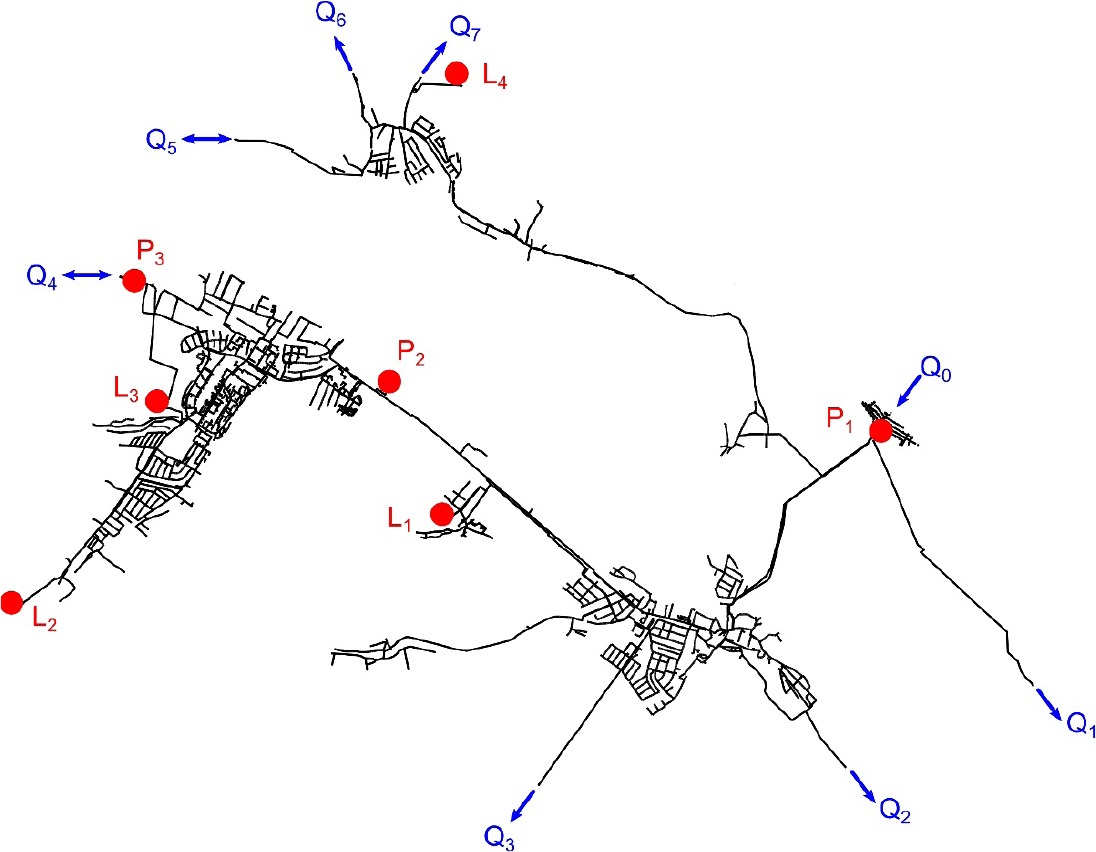
Figure 1 shows a regional network on the right. Arrows indicate volume or flowrate measurement points and circles indicate pressure (or water level in storage tanks) measurement points which appear in the SCADA system and can be used as boundary conditions. Note that if the indicated region of a network has to be calculated, boundary conditions are insufficient for calibration. For example if any of the Q1,2,3,4,5,6,7 flow boundary conditions, where no additional pressure is measured, are missing, the consumption cannot be determined in the investigated part at all. The most important data for calibration can be found at those points where flowrate and pressure are registered simultaneously (P1 pressure on pump outlets with the Q0 inflow in Figure 1).
Figure 1
Map of a typical drinking water distribution network of three interconnected towns in Hungary, with the possible hydraulic boundary conditions: water levels in storage tanks (L), pressure (P), flow (Q).
The elevation of the water level in open storage tanks can also be considered a well-defined pressure boundary condition and are important for calculating the water consumption from the balance of the stored water volume as well. In most SCADA systems, only an arbitrary percentage of the water volume or level in the storage is usually registered, and the true elevation above sea level, or the physical volume of water in the storage, cannot be inferred directly from measured data.
Another deficiency of the typical Human-Machine Interfaces (HMIs) is that they are designed only to represent the measured data but do not give any hint about the real layout of the system, with a few exceptions, e.g. some maps are available with the objects represented on the screen. There are solutions which can integrate even measured real time data into network hydraulic simulation (Sunela and Puust, 2015, pp. 744–752), but their added value compared to the standalone simulation may not entirely justify the extra effort their introduction requires.
Model building
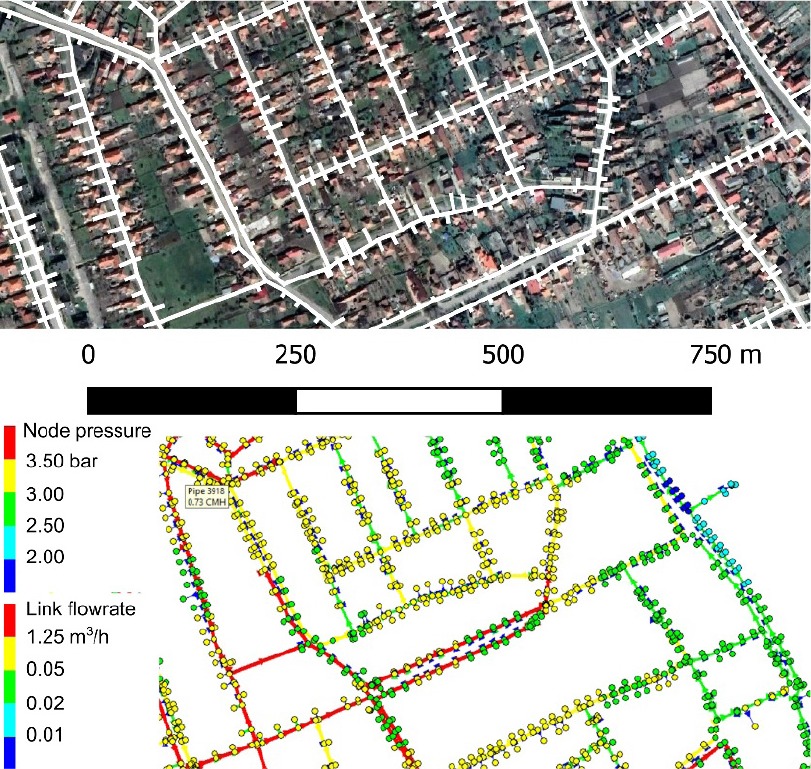
Figure 2 shows a digital map available in the national public utility database with a satellite image as base map on the top, and a hydraulic model with calculated data on the bottom. This hydraulic model was made by using a .dwg format AutoCAD file obtained from the local waterworks. Geometry was processed using the open source Qgis software to create a proper topology and to assign proper attributes to pipes and nodes. For pipes, the diameter, material and roughness must be specified. It is also good practice to use a field in the database to distinguish between main pipes under streets and small diameter pipes which connect the consumers to the network. Short pipe segments, which connect fire hydrants, fountains etc. to the network, can also be included to get a detailed system. In the same manner, nodes can be grouped as endpoints of main pipe segments, endpoints at a consumer’s, fire hydrants, etc.
Figure 2
Part of the water distribution network from the study area, as available in the national database as raster image (top) and as spatial database with calculated hydraulic data (bottom).
The accessibility of the spatial database containing maps of the drinking water distribution systems raises some important questions about security and the effectiveness of model building. In Hungary, precise spatial data is sold by the state to designers, who have to purchase the data when a facility which affects a public utility in any manner is designed. For this reason, the public map, which can be viewed by any citizen online at a maximum 1:2000 scale, does not contain enough data to create a working hydraulic calculation, but the map itself reveals the structure and the vulnerable points of the network. A comparison of the map of the pipe network and any free online satellite image readily reveals vulnerable points, main lines from storage tanks, the storage tanks themselves, treatment facilities, and raw water extraction points. On the other hand, this database should be even more accessible and detailed in order to allow access for local authorities, research institutions and governmental organisations responsible for and interested in handling emergencies. With the help of this data, they can develop, simulate and synchronise their own tactics for emergency handling. This contradiction may be resolved in the future by proper cybersecurity solutions, granting access to the database for organisations involved in safety assessment.
Model calibration
A drinking water distribution system of a small settlement with five thousand inhabitants was used to carry out the simulations of interest. As shown in Figure 3, the network inside the town does not contain any storage facility, so a pressure and flow boundary condition can be easily defined on the two main pipes that connect the settlement to a large capacity regional pipeline. Because of this, the only uncertainty introduced into the calculated flowrate is due to consumption defined at the consumer end. The model of the network is highly detailed, as it contains the endpoints at the consumer end and the fire hydrants as well. The geometry consists of 4426 edges (pipe segments) and 4326 nodes.
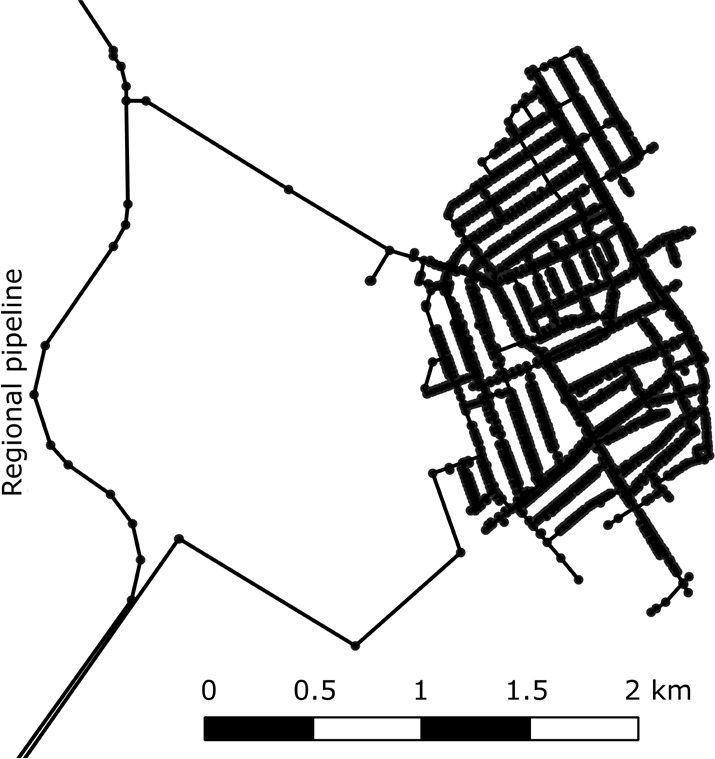
The flow and pressure boundary condition on the main regional line is determined by the elevation of the water tower at one end of the pipe, and the pumping station at the other end. In order to set the pressure and the flow in the main line, the speed and operation time of the pumps were set according to time series registered by the SCADA system on a selected day. The model is calibrated to return the measured flowrates and, therefore, the calculated pressures showed a 1-1.5 bar deviation from the measured values. The reason for this is that the true spatial and temporal variation of consumption in a large city at the end of the main pipeline affected the measured values. Due to the spatial variation of real water consumption, a lower uncertainty for pressure values usually cannot be achieved when flow boundary conditions are given (Jose and Sumam, 2016, pp. 332–338).
Testing the scenario of contamination from the direction of consumers
It is a well-known that the effectiveness of disinfection is not constant along the distribution network. In general, the higher the residence time (the water age), the less disinfectant is available in the system to inactivate pathogens. Normally, as long as the water only flows in one direction (from the network to the consumer), no problem arises. Although contamination in the pipe network is fairly rare in developed countries, it should be noted that it only takes a few extra bars above the system pressure (which is a maximum 6 bar at the consumption point according to Hungarian regulations) to create a potential backflow from the plumbing of a private property towards the network. Careless real estate owners, who connect their own (and untreated) private water supply to the piping of their buildings can be considered an emerging issue, as private water supplies gain in popularity.
If suspicion of contamination from an internal source arises, it is the priority of every responding organisation to:
inform the citizens and restrict water consumption;
localise and handle the source of the contamination;
restore the working state of the distribution network.
The second step can only be achieved by taking and analysing water samples from different points of the network and putting the results on a map. Dynamic simulation of the hydraulic and water quality conditions may present an advantage in the third step. If an estimation about the position of the contaminated parts can be made at an early stage, the rest of the network can be closed off, or the location of the source can be narrowed down to a few streets or blocks.
This study only deals with the question of biological contamination, because that is what represents the most likely emergency. Private water supplies, which rely on untreated or partially treated groundwater, surface water and possibly recycled water, most likely contain viable microorganisms, along with reducing components. The most common inorganic reducing components can be iron (II) and manganese (II) compounds and ammonium, which are fairly common in shallow groundwater wells. Organic matter in water supplies is usually a complex matrix of different components, called NOM (Natural Organic Matter), that are present in both surface and subsurface water bodies. Reducing components with a substantial chlorine demand combined with microorganisms can present a high risk when carelessly introduced into the network.
In present practice, contamination is mostly indicated by microbiological analyses. The drawback of this kind of inspection is that tests need a few days because of the time required to cultivate microorganisms. Even though modern and more rapid methods such as PCR (Simões and Dong, 2018, p. 2) and metagenomics (Bibby et al., 2019, pp. 1–13) can be used to detect pathogens, their costs are fairly high and they are not readily available in the field as of yet. Even if pathogens could be quantitatively determined from water samples, their concentration would be hard to correlate with hydraulic conditions and distance from the source because they can multiply and grow in the bulk liquid and are able to form colonies on pipe walls and in stagnant zones acting as secondary sources.
If hydraulic and water quality simulation is used as a tool for the investigation of possible contamination sources, other water quality parameters should be selected to indicate and trace the contamination. These should be rapidly measurable in the field. Such parameters are UV absorbance at 254 nm, ammonium and nitrite to detect fresh organic matter. Disinfectant concentration, such as active and total chlorine, may be the best indicator of contamination sources because liquids and suspensions with organic matter and pathogens usually deplete the available chlorine rapidly. Measurement of ATP, which is directly linked to the amount of microorganisms present and can be carried out in the field (Liu et al., 2020, pp. 5619–5628), may be an efficient method for finding contamination sources.
For a simple mathematical description of chlorine decay, the so called 2R model (Jamwal, Naveen and Javeed, 2016) was used. This model uses second order kinetics, where the rate of chlorine decay is directly proportional to chlorine concentration and to the concentration of the rapidly and slowly reducing matter. Other mathematical models and kinetic data for chlorine decay are readily available in the literature (Monteiro et al., 2014, pp. 485–498). The 2R model uses the following equations (Fisher, Kastl and Sathasivan, 2011, p. 4899):
where kF and kS are the rate coefficients for the fast and slow chlorine reduction, and cCl, cF, cS are concentrations (in mg/L or µg/L) of active chlorine, fast and slow reducing substances, respectively.
It should be noted that a calibration field test, at least for slowly reducing matter, must be carried out to determine the chlorine decay rate in a system without contamination. It is necessary because the rate constant can vary considerably due to environmental conditions (e.g., temperature, biofilm thickness, turbulence, pipe material, etc.) as shown in Table 1.
Table 1
Different values for rate coefficients of the 2R model.
| Temperature (oC) | kS (L/mg/d) | kF (L/mg/d) | Source |
|---|---|---|---|
| 15.5 | 0.8712 | 45.84 | (Fisher, Kastl and Sathasivan, 20 11, p. 4901) |
| 3.5 | 0.5808 | 60.72 | |
| 15.5 | 1.2144 | 63.6 | |
| 28.0 | 3.024 | 152.16 | |
| - | 0.2448 | 6.264 | (Fisher, Kastl and Sathasivan, 2012, p. 3298) |
| - | 0.15984 | 4.776 | |
| - | 2.004 | 148.32 | |
| 13.0 | 0.17 | 6.74 | (Monteiro et al., 2014, p. 1196) |
The 2R model can be considered suitable for the investigated situation because with the help of the slowly reducing matter, natural chlorine decay can be accounted for in the network, while with the help of fast reducing matter, fresh contamination can be modelled.
Data about the chlorine decay rate in itself may not be enough for localisation; in order to estimate the extent of the contamination, flow velocities in the pipes must also be taken into account. That is why static spatial representation of water quality is necessary, but it may not be enough to trace the source. Dynamic simulation, on the other hand, can give an estimation about the transport of materials in the pipes, which may help localise the source.
In order to test how chlorine behaves when organic contamination is introduced from the direction of consumers, a hydraulic simulation is set up on the part of the network described above. With the use of the EPANET software (Rossman, 2000, p. 9), an extra pressure of 1.0 bar was defined on a consumption point (Node 2600) in order to simulate backflow from the real estate of a consumer. This resulted in a 1 ± 0.5 m3/h flow into the network, depending on the changing pressure in the main line.
For calculating the spatial distribution of water quality, a multispecies extension of the EPANET program (EPANET-MSX) was used. The rate constants for fast and slow reducing matter were set to kF = 1 d-1 and kS = 0.1 d-1, respectively. The water fed to the regional pipeline was set to contain a chlorine level of 500 µg/L and 10 mg/L chlorine equivalent slow reducing matter. The simulation duration was 48 h and a snapshot of the concentrations of different species (fast and slow reducing matter and chlorine) at 37:00 hours simulation time was taken. The initial setup can be found in the supplementary material. The results were imported into the Qgis geospatial information system for visualisation after shorting and database creation. When normal operations were taking place, chlorine concentration ranged between 300 – 500 µg/L throughout the whole settlement.\
For simulation of contaminant inflow, concentrations of fast and slow reducing matter were set to cF = 10 mg/l and cS = 100 mg/l in the contaminating water, which enters the system from Node 2600. In Figure 4, it can be seen that a short segment with depleted chorine is present. Decreased chlorine levels are not only present in the immediate vicinity of the source, but in other sections further downstream as well. These results indicate that chlorine concentration does not show a monotonous decrease as the distance from the source increases due to changing flow directions and varying pressure in the network.
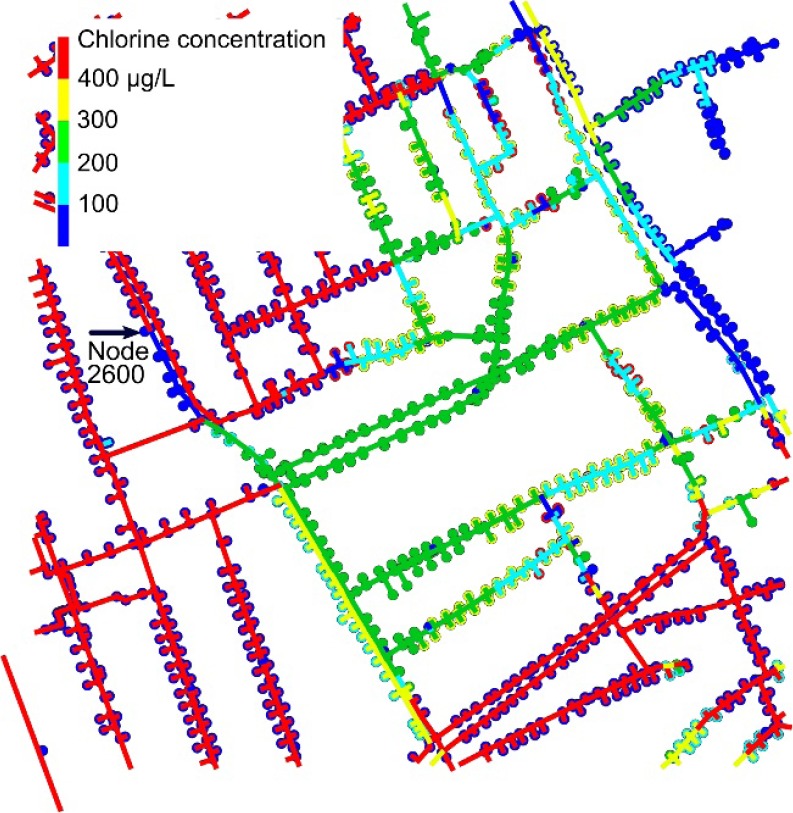
A comparison was made between chlorine levels in normal operation and chlorine levels when a contamination source is present on the network. Figure 5 was made by subtracting calculated values of chlorine concentration with contamination from the values with normal operation for every node and pipe segment. Spatial distribution of the amount of chlorine depleted by the contamination shows high values directly downstream at the source as expected. It is more alarming that even higher chlorine depletion can be observed further downstream in random pipe segments. This result is due to the unpredictable variation of temporal changes in consumption and stagnant zones where the decay of chlorine is magnified due to greater water age.
Figure 5
Difference in chlorine concentrations when contamination is present compared to normal operation.

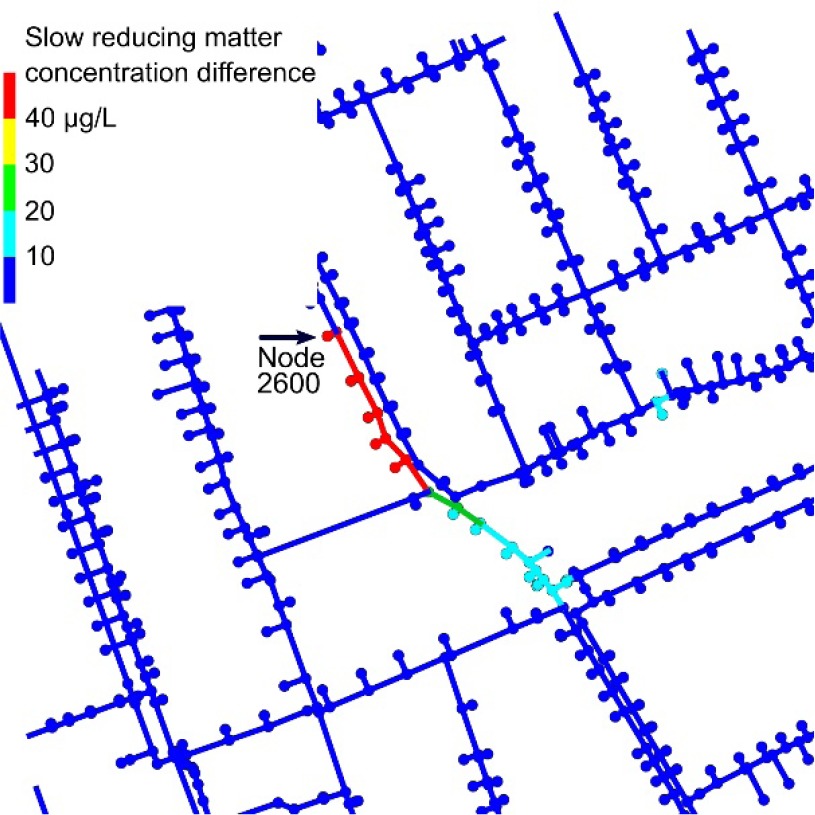
The spatial distribution of difference between normal operation and contamination for the concentration of fast and slowly reducing matter is shown in Figure 6 and Figure 7. As expected, both are at high concentrations right downstream from the contamination source, but slowly reducing matter travels further. This result is due to the nature of the simulated chemical reactions kinetics in which once the organic matter is reduced by chlorine, it is no longer present in the system.
Figure 6
Difference in fast reducing matter concentrations when contamination is present compared to normal operation.
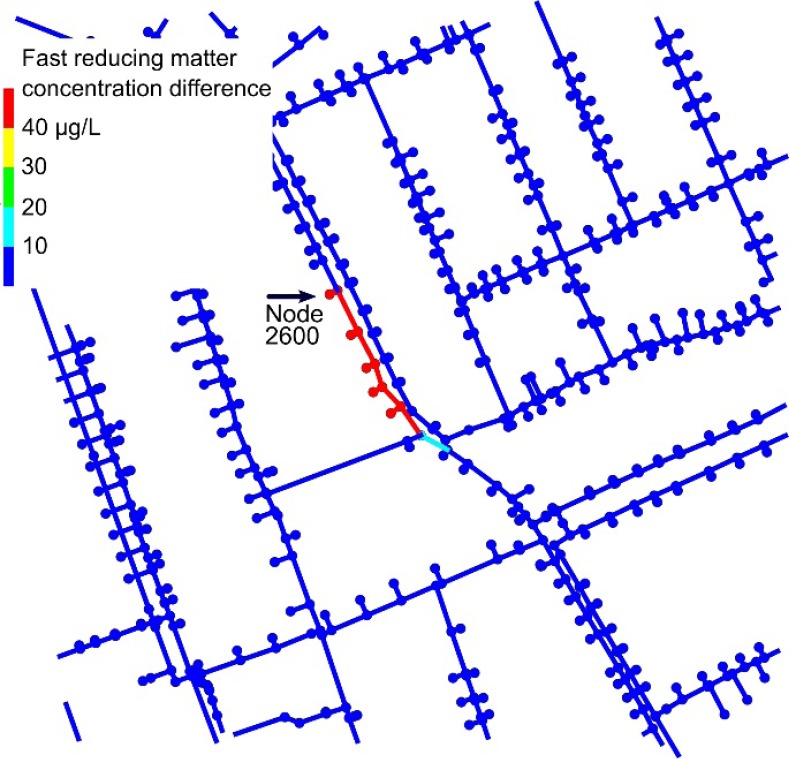
Figure 7
Difference in slow reducing matter concentrations when contamination is present compared to normal operation.
When reducing matter is used to model normal chlorine decay in the distribution system in these kinds of simulations using the 2R model, we can only expect to find the source of the contamination, if it is indeed contains fast reducing matter, which can be distinguished from the former. Conditions required for this situation are: a.) fast reducing matter must be present in a concentration close to source, which makes it to detectable on its own; and b.) chlorine depletion caused by fast reducing matter must occur before bulk liquid with depleted chlorine moves too far away from the contamination source. If flow velocity is too high, chlorine depletion will be detected further from the source and the reliability of the simulation decreases significantly.
Other possible applications – water supply through a section of the network
Apart from regular ruptures to the main water pipes, physical destruction of storage tanks, pumping stations and pipes are not common in Europe. It is quite rare that explosions due to accumulated methane occur and annihilate water towers or storage tanks. As long as only one settlement or only a zone of a larger city is affected, it is possible to transport drinking water in tankers from neighbouring settlements.
Regional water distribution networks, which connect more than one settlement with loops, are less vulnerable to the malfunction of local storage, because water can flow from different directions from other distant storages on the network. Branched parts of regional networks are more vulnerable, because any failure in a main pipe or a storage tank prevents proper water service at upstream consumption points. It is expected that malfunctions in the Hungarian water mains will be more frequent in the future, as the average age of network pipes increases and the current rate of reconstruction is inadequate to keep up with ageing pipe materials like asbestos cement.
Most of these malfunctions can be routinely handled by operators, but there are no contingency plans in place for extreme emergencies when water supply is disrupted in a whole region or a large number of settlements, in a manner that makes it impossible to transport drinking water in tankers from one source to another. In such an event, it is possible for citizens to use groundwater or surface water, or even rainwater if collection facilities (cisterns) are available, with basic household treatment (settling, filtering and boiling). But other critical institutions (hospitals, food service, etc.) of the settlement may require a steady and properly treated amount of drinking water, which can only be achieved if the settlement in question has an alternative, independent water supply and is able to restore the service at least temporarily to a portion of the distribution network. This scenario seems unlikely in developed countries with an ample amount of natural freshwater reserves but, sadly, it can occur in less secure locations affected by water scarcity (Pollard, 2018, p. 148). It should be taken into account that while food and other essential supplies can be stored, properly treated drinking water will probably be the first to run out and the last of the public utilities which is restored.
Hydraulic simulation and spatial data about the distribution network, if available and familiar to the people responsible, can be an effective tool for advance planning and mitigating the effects of the situations described above. The method proposed and investigated is illustrated in Figure 8.
Figure 8
Unusable portion of pipe network (red) and selected section for temporary supply (green). Blue trace lines are the identified segments to be closed off.
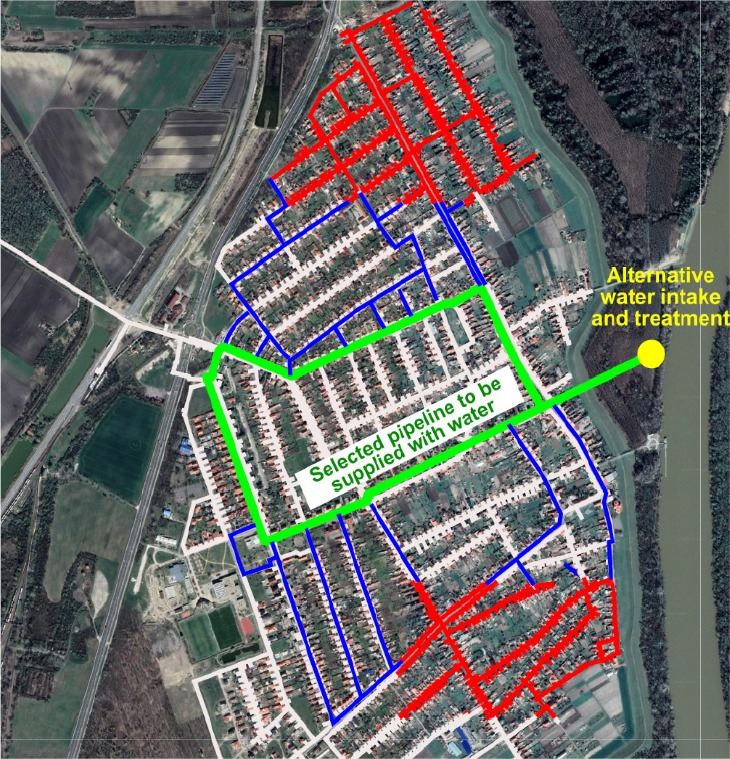
An ample amount of network and route analysis tools are available in modern GIS applications (Pella and Ose, 2018). Although geospatial representation helps the operators to rapidly enlist and identify the pipe segments to be closed in the event of an emergency, other advantages can be utilised. On a large and complex network, it can be ambiguous which segments should be closed off in order to isolate a certain area. Instead of a manual search, automated algorithms can be used to quickly identify the points of intervention. Their detailed description and implementation by programming would exceed the scope of this study. A simple method for obtaining the results illustrated in Figure 8 is described instead.
The starting information is the set of lines representing the pipeline which is intended to be operational in extreme conditions. This is shown in green in Figure 8. The selection can be made in advance or, if it is necessary, it can be selected on the spot within a geospatial application, taking the actual situation into consideration. The portion of the network which is either destroyed, unoperational or contaminated can also be selected in the digital representation of the network. This portion is shown in red in Figure 8. This selection requires some estimation, however, because field personnel can only estimate the extent of damage on site.
If there is a point-like event, e.g. a burst pipe, the leak can be localised and the pipe segment can be closed off without any prior spatial analysis. If a larger portion of the network is damaged, e.g. due to an earthquake, a set of locations (a set of points), representing the observable damage will be available to decision makers. Therefore, the selection of the “red” area can be subject to error of judgement. Every task that involves modelling has its limits because data is not always available and estimations have to be made.
Once this initial information is available, various analyses can be put to good use to handle the actual problem. The example in Figure 8. shows the pipe segments in blue, which represents the least amount of direct connection between the green provisional supply line and the unoperational red part. The trivial solution would be to close all the valves on the pipes that lead to the red unoperational zone, but with the help of graph analysis, a minimum number of pipe segments can theoretically be selected. When they are closed, this solution offers the same isolation and, therefore, the damaged or contaminated portion of the network can be sealed off faster. Considering that the opening and closing of valves on large diameter pipes can take half or even one hour and that the number of personnel is limited, limiting the number of closed segments can save valuable working hours.
With the help of the analysis described above, not only is the selection of network portion possible based on rapid hydraulic calculations, but this kind of analysis supports the design of important facilities in advance, e.g. required pumping capacities, closing points, etc.
Geospatial data can be used to select a portion of the network to be operated even in an extreme emergency. Hydraulic simulation can be used to design and select the proper pumping capacity and necessary equipment in advance. By simulating the behaviour of the system, a strict but optimised water supply schedule can be introduced. By doing this, the most important institutions can be supplied with water, and by making public fountains and fire hydrants operational, a greater impression of order and safety can be maintained for the inhabitants of the settlements.
Other possible applications – tool to train operator personnel
In general, it is (or it should be) common policy that operators of public utilities must have a good social security status to compensate for extra responsibilities and duties. Prerequisites of the daily work should also be strictly maintained at all times. Because of these customs, it is often overlooked that a human workforce and human relations required to keep the drinking water distribution network in working condition are almost as vulnerable as the physical infrastructure itself.
There are a large number of possible situations when operating staff can become incapacitated at the same time. These possibilities range from disruptions to public transport, public demonstrations, natural disasters and pandemics. The latter is expected to severely affect waterworks personnel, not only because of the elevated levels of exposure to sanitation, but because of the greater requirements of hygiene for anyone who comes in contact with drinking water. In Hungary, the ageing workforce can be considered an added risk not only for sudden emergencies, but for long term replacement as well.
In order to train a lot of personnel to be ready to supply drinking water with the help of the distribution network under extreme conditions in a short period, some prerequisites must be met. The current process control and public utility database require some minor modifications in order to be more transparent and easy to understand. This small development could be extremely helpful when an experienced crew is unavailable and other personnel must be familiarised with the system in a short time.
The most important missing information on regular HMI screens is the elevation of critical objects: pump inlets and outlets, storage structure bottoms and overflows. The network should also be represented in some manner that allows the operator looking at the screen to rapidly understand the connections, especially in the main valve chambers.
Practical training for extreme emergencies cannot be executed on a live system, which serves consumers twenty-four hours a day. In this respect, hydraulic and water quality simulation offers the greatest advantage. An exact replica of the HMI of the SCADA system can be set up to pass parameters to the hydraulic simulation. A block diagram for such a simulation setup is shown in Figure 9.
Figure 9
Hydraulic model of drinking water distribution system connected to simulated HMI to be used for training and investigation of system behaviour.
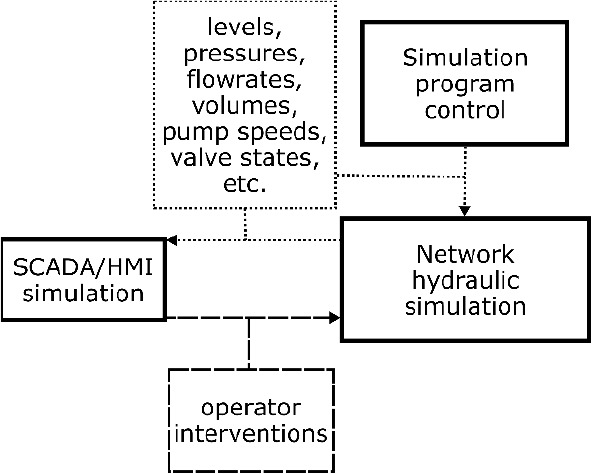
There are advanced solutions which integrate hydraulic simulation with SCADA systems. In these solutions, the model is run and updated based on measured and collected values. In this manner, hydraulic conditions in the network can be assessed and even predicted real-time (Sunela and Puust, 2015). These solutions use measured values to calibrate and validate hydraulic calculations. Due to the advantages they possibly represent, these solutions have gained a lot of attention in the last decade (Wu et al., 2011). The main goals of developing such systems were to make predictions and warnings about changes in normal network operation. Only a limited amount of literature is available about connecting simulated network hydraulics to SCADA systems for purposes other than hydraulic calculations, e.g. Shu (2011) briefly mentions a connection port used between the SCADA system and their hydraulic model for the investigation of chlorine decay. The solution proposed here differs from this traditional approach and can be considered a novel concept, because the same, but simulated, SCADA system is connected to the simulated hydraulic model instead of the real process.
When this environment is used, either for the assessment of the network or to train operators, the traditional workflow is reversed, and data acquisition gathers values calculated by the hydraulic model. The control commands issued by the operator alter parameters of the hydraulic simulation, which in turn calculates the new state and results appear through data acquisition again. Besides simulated SCADA and network hydraulics, another control is necessary, where boundary conditions and different scenarios to be simulated can be set. As of yet, no such simulation and training environment exists in Hungary, but HMI interfaces and network hydraulic modelling software are available both commercially and as open sources. The missing part to be implemented is the real time control of simulation and the back and forth data exchange between the HMI and the hydraulic model. Note that the hydraulic model can run in a GIS environment, but the HMI/SCADA simulation may require a different program run in parallel. This framework could be useful for investigating the behaviour of the process control depending on changes in the hydraulic conditions in the network.
If manual operation is necessary because of the severity of the situation, the network map and indicated locations of the most important functional parts in the simulator can also be a great help for urban management and authorities. Even if someone does not work with the distribution system every day, but has practised the logic of the workflow occasionally, he or she will be able to carry out basic operations and solve certain situations which otherwise severely disrupt water supply for the whole settlement.
Training with the help of these kinds of simulations may be in the interest of any organisation aiming to keep the settlement running and solve emergency situations. These groups may include: public servants of local government, urban planning, military engineering corps, engineering volunteer reserves, civil guards, fire departments, fire brigades, engineering students and so on.
Conclusion
The building of the hydraulic model revealed that if the topology is available in a proper digital format, the setting up of the geometry is efficient and straightforward. It is not an easy task to obtain measured values to define proper hydraulic conditions. A paradigm shift is required on the part of both operators and designers to better utilise and analyse previously ignored daily operational data and put computerised hydraulic and water quality calculations to better use, not only for their own purposes, but in order to help a wide variety of groups who are interested in solving crises related to drinking water distribution networks.
The investigation of contaminant source localisation revealed that if only slowly reducing matter is involved to deplete chlorine and promote contamination, localisation of the source may be impossible not only because of the uncertainties of the supporting hydraulic and water quality simulation, but because of the detection limits in field measurements as well. Based on experiments with the simulation under different boundary conditions, one of the highest factors of uncertainty is spatial and temporal distribution of water consumption, which determines flow directions and velocities. The other major contributor to the uncertainty of the calculations is kinetic parameters of chemical reactions under real conditions in the field. Simulation results showed that measurable traces of contamination may be detected as far as 100-500 m from the actual source under normal flow conditions. In order to make these applications more useful in handling emergencies, improved, probabilistic mathematical descriptions of hydraulic boundary conditions should be investigated along with more data related to kinetic parameters of the involved chemical reactions.
To prevent contamination flow from consumers, entering houses and investigating illegal pipe connections (given that they are not hidden by the owners) are only feasible in smaller settlements; in larger cities with great population density and multi-storey buildings with complex plumbing, the detection of a contamination source by inspection alone can take an unacceptably long time. A pre-emptive measure may include the technical drawing of internal plumbing along with its connection to the public network being stored in the same geospatial database as the distribution network itself, and any unregistered alteration compared to the allowed plan is sanctioned.
The investigation of the applicability of GIS tools revealed that even simple geospatial algorithms can be useful in order to rapidly identify critical locations and make necessary countermeasures. It was revealed that while computerised calculations are suitable for localising the problem and finding optimal solutions, the lack of input data can be a source of uncertainty. Nevertheless, even with estimated data, the overview these GIS representations can provide is an essential aid for decision makers.
The described use of GIS and network hydraulics tools along with simulated SCADA environment can be an effective tool not only in general training, but also in preparing people for emergencies related to drinking water distribution networks. The solution outlined in the study aims to illustrate the possible use of such frameworks. Before any of the proposed solutions can be tested in practice, further research and data collection is required.
The next steps of research must include the reduction of uncertainty in hydraulic simulations and the development of special algorithms for analysing results from network hydraulic simulations. Development of the simulation environment described is also a task for the future. In order to reduce the uncertainty introduced into hydraulic calculations, extensive data collection is necessary with regard to the spatial and temporal variation of water consumption, as well as losses and flowrates in damaged network segments. As leak detection and water loss monitoring becomes an increasing demand on the Hungarian drinking water distribution network, data obtained can be used to carry out further research. It can be expected that simulation will be an important tool in the future, playing a major role in increasing the resilience of drinking water distribution networks.