
Introduction
For several years, NATO has been facing multi-dimensional, complex, and cross-border threats and crises. Three decades of post-Cold War peace period in Europe has ended abruptly with Russia’s full-scale war against Ukraine. Security threats are confronting Europe in the form of terrorist attacks, cyber attacks and hybrid warfare, blurring the lines between conventional and unconventional forms of conflict, between civilian and military, state and non-state, peace and war. The evolving security environment, including future uncertainty about the transatlantic relationship, is increasingly acknowledged in Europe. Simultaneous cooperation, competition, and conflict make today’s global environment increasingly unpredictable, and imply that Europe must adjust for an era of fierce geopolitical competition.
While the West—though declaring itself united—is increasingly fractured politically, militarily, and economically, the newly formed “axis of dictatorships”—an informal alliance of China, Russia, Iran, and North Korea (CRINK)—accelerates to consolidate and arm (Center for Strategic and International Studies [CSIS], 2025). As noted by Michta (2024), the reality is that we face not a strategic competition anymore; rather, it is already Phase Zero of a protracted conflict with the “axis of dictatorships.” In these early stages of a system-transforming war Russia and China are setting a new imperialist agenda, while Iran and North Korea work to dismantle what’s left of their regional power balances (Snegovaya et al. 2025).
The changing nature, scope, and scale of threats facing Europe requires a robust strategy to enhance preparedness and readiness for any type of conflict including a protracted war, as stated in the European Union’s (EU) White Paper on European Defence Readiness 2030 (Council of the European Union [JOIN], 2025). The political will to enhance defence preparedness is demonstrated in the Conclusions of the 2025 Special European Council Summit on European Defence and Ukraine: “The European Union will reinforce its overall defence readiness, reduce its strategic dependencies, address its critical capability gaps and strengthen the European defence technological and industrial base.”
To achieve a European defence readiness that can deliver on security needs (including the necessary military support for Ukraine), this political commitment will have to be converted into military capabilities with a sufficient deterring signalling effect to potential adversaries. Therefore, NATO (2025) and the White Paper on European Defence Readiness 2030 calls Europe to rearm. The new global realities imply that peace and prosperity in Europe will have to be defended by Europe. A practical implementation of a European rearmament strategy requires decision maker knowledge of the capability gap that needs to be closed, which is far from obvious. Answering this question requires detailed knowledge about the current state and a quantifiable measure of the targeted defence readiness. According to JOIN (2024):
Defence Readiness can be defined as a steady state of preparedness of the Union and its member states to protect the security of its citizens, the integrity of its territory. This includes an ability to provide military assistance to its partners, such as Ukraine.
This study aims to enhance the situational awareness by investigating three related questions: How prepared is Europe to cope with a protracted conflict and war? Which additional challenges would Europe face in a worst-case scenario? What strategies can enhance its readiness?1 The analysis is guided by NATO (2025) and the White Paper on European Defence Readiness 2030 (JOIN, 2025), which outlines the key defence issues in Europe—including critical capability gaps of forces; challenges of the defence industry and military mobility—and provides a framework for ReArm Europe. A contemporaneous assessment aims to quantify the critical capability gaps faced by European allies currently. Further, the White Paper underlines the need to strengthen the European defence readiness for worst-case scenarios. This study analyses a hypothetical worst-case scenario to examine the resilience of European defence readiness to changing boundary conditions. Comparing alternative courses of policy action allows the identification of the most effective and efficient strategy to enhance readiness.
To evaluate the defence preparedness and readiness empirically, this study leverages historical and contemporaneous defence data on Europe in a descriptive statistical analysis. The findings from the situational assessment reveal critical capability vulnerabilities in the European defence readiness. Both the examined defence capabilities at the tactical level and the cross-border military mobility contribute to vulnerabilities in the overall European defence readiness. To stress-test European preparedness and readiness in a hypothetical worst-case scenario, an empirically validated mathematical model, the EU Economic Modelling System (EU-EMS), is leveraged (Kancs 2024b; Kancs 2025a). Scenario analysis results suggest that today’s existing problems of European defence readiness will only be amplified in the simulated global shock triggered by CRINK. By quantifying the potential cost of unpreparedness, the study provides a measurable rationale for European allies to embark on a rapid de-risking trajectory, rather than waiting for a much more costly and abrupt shock trigger dictated by increasingly unpredictable CRINK.
NATO defence readiness in Europe: A situational assessment
Defence readiness is composed of a wide set of inter-related elements, including human capital, global posture, force structure, resilience, sustainment, modernisation, allies and partners, business systems and organisational effectiveness, and operational readiness (US Department of Defence, 2023). This study, inherently limited in scope, does not take a deep dive into every single dimension of defence readiness. Instead, guided by NATO (2025) and the White Paper on European Defence Readiness (JOIN, 2025), one critical defence capability at the tactical and one enabler at the operational level are selected, assessessed them in detail, and publicly releasable findings presented.
Defence capabilities at the tactical level
To assess the current state of European defence readiness, a relevant measure of defence readiness is required. While the overall concept of defence readiness has clearly been defined as a steady state of preparedness, to date, European allies have not agreed on quantifiable and measurable defence readiness targets in terms of capabilities required to protect the security of its citizens and the integrity of its territory. In the absence of the envisaged defence readiness end state, how can Alliance’s present status in terms of defence capabilities be determined and how do we know when European defence readiness end state will be achieved? With regard to a measurable readiness target, the situation of the United States after the sudden and unprovoked communist aggression against the close ally Republic of Korea in 1950 can serve as an example. Indeed, it is comparable to the current situation in Europe since Russia’s aggression against Ukraine in 2022. In the Quarterly Report of April 1951 to the President, four mobilisation readiness targets were specified. The first was “to produce military equipment for our armed forces, for aid to our allies and for reserve stocks which would be available for the first year of full-scale war if, in spite of all efforts to prevent it, one should break out.”
Using historical data, this study constructed a quantifiable and measurable benchmark for European defence readiness, based on which Europe’s current state of readiness can be evaluated. The study looked back to selected European allies’ defence capabilities during the Cold War. Specifically, the study leveraged the International Institute for Strategic Studies’ (IISS, 1991) military balance data to compute the stocks of military equipment possessed by European allies in 1990. The focus was on ground, naval, and air forces, from which the study selected eight types of key weapon systems that best reflected a country’s military capabilities in the analysed period. These are (1) main battle tanks (MBT), (2) infantry fighting vehicles (IFV), (3) armoured personnel carriers (APC), (4) artillery (guns, towed and self-propelled howitzers [ARTY/HOW]), (5) mortars (MOR), (6) submarines, (7) principal surface combatant (PSC), and (8) combat aircraft. Subsequently, the study used the IISS’ (2025) military balance data to calculate the stocks of the same types of military equipment in 2024. To benchmark the current state of European defence readiness against defence capabilities in 1990, the current stocks (2024) were compared to the stocks in 1990. Tables 1 and 2 report the stocks of the existing military equipment of selected European allies in numbers of units in 1990 and 2024. Whereas Table 1 displays the results for ten “old” North Atlantic Treaty Organization (NATO) allies, Table 2 reports inventories for eight “new” NATO allies.2
Table 1.
Stocks of key weapon systems of selected “old” NATO allies in 1990 and 2024. Source: Estimations based on IISS’ (1991 and 2025) military balance data.
Table 2.
Stocks of key weapon systems of selected “new” NATO allies in 1990 and 2024. Source: Estimations based on IISS’ (1991 and 2025) military balance data.
Tables 1 and 2 document a substantial reduction in the available inventories of key weapon systems across European allies over the last three decades. The decline in European ground capabilities since the end of the Cold War is particularly striking. The stocks of MBT have decreased substantially in all analysed countries except Finland (Table 2). Belgium and the Netherlands had no MBT in their inventories in 2024 (Table 1), whereas Belgium had 359 and the Netherlands had 913 MBT in 1990. In France, Germany, and the United Kingdom, the stocks have declined by 84–88%. The relative decline in stocks is applicable to other armoured fighting vehicles (IFV and APC), except for IFV in Poland, the inventories of which have increased. The inventories of artillery (ARTY, HOW, and MOR) have declined even more dramatically in most countries. For example, Germany currently only has 1.5% of artillery guns and howitzers of its stock in 1990. The inventories of submarines and principal surface combatants have declined in all analysed countries too, although less critically. The current stocks of combat aircraft range from 9% in Bulgaria and Hungary to 75% in Finland vis-à-vis inventories in 1990.
How should we interpret these figures of Europe’s current defence capabilities in the context of Russia’s war against Ukraine and Europe? According to Burilkov and Wolff (2025), to prevent a rapid Russian breakthrough limited to the three Baltic states, which have a combined population of six million people, would require a minimum of 1,400 MBT, 2,000 IFV, and 700 artillery systems (155 mm howitzers and multiple rocket launchers). This implies that the required combat power to defend only the Baltics would absorb the majority of the combined inventories of the European allies’ land forces (Table 1). Providing these weapon systems with sufficient munitions is essential too, beyond the bare bone stockpiles currently available, as currently Russia is producing artillery shells around three times faster than European allies combined and for about a quarter of the cost. According to Burilkov and Wolff (2025), one million 155 mm shells would be the minimum requirement for 90 days of a high-intensity combat.
Hence, the conversion of the political will—as expressed in the Conclusions of the 2025 Special European Council Summit on European Defence and Ukraine—into defence capabilities seems to be far behind what is required to “protect the security of its citizens, the integrity of its territory” along the 3,850 km land border with Russia and Belarus. A natural question arises: “Given that Europe has been facing a full-scale war for more than 3 years, why are the critical capability gaps of NATO in Europe allies so sizeable?”
To answer this question in a structured way, this study looks into the key problems, drivers, and consequences of defence capabilities. They are mapped in Figure 1, where three major issues of capabilities at the tactical level are identified: a sluggish upscaling of demand for military equipment, unexploited production potential, and security of supply vulnerabilities.
Figure 1.
Situational assessment of problems, drivers, and consequences of defence capabilities. Source: Based on EC (2024).
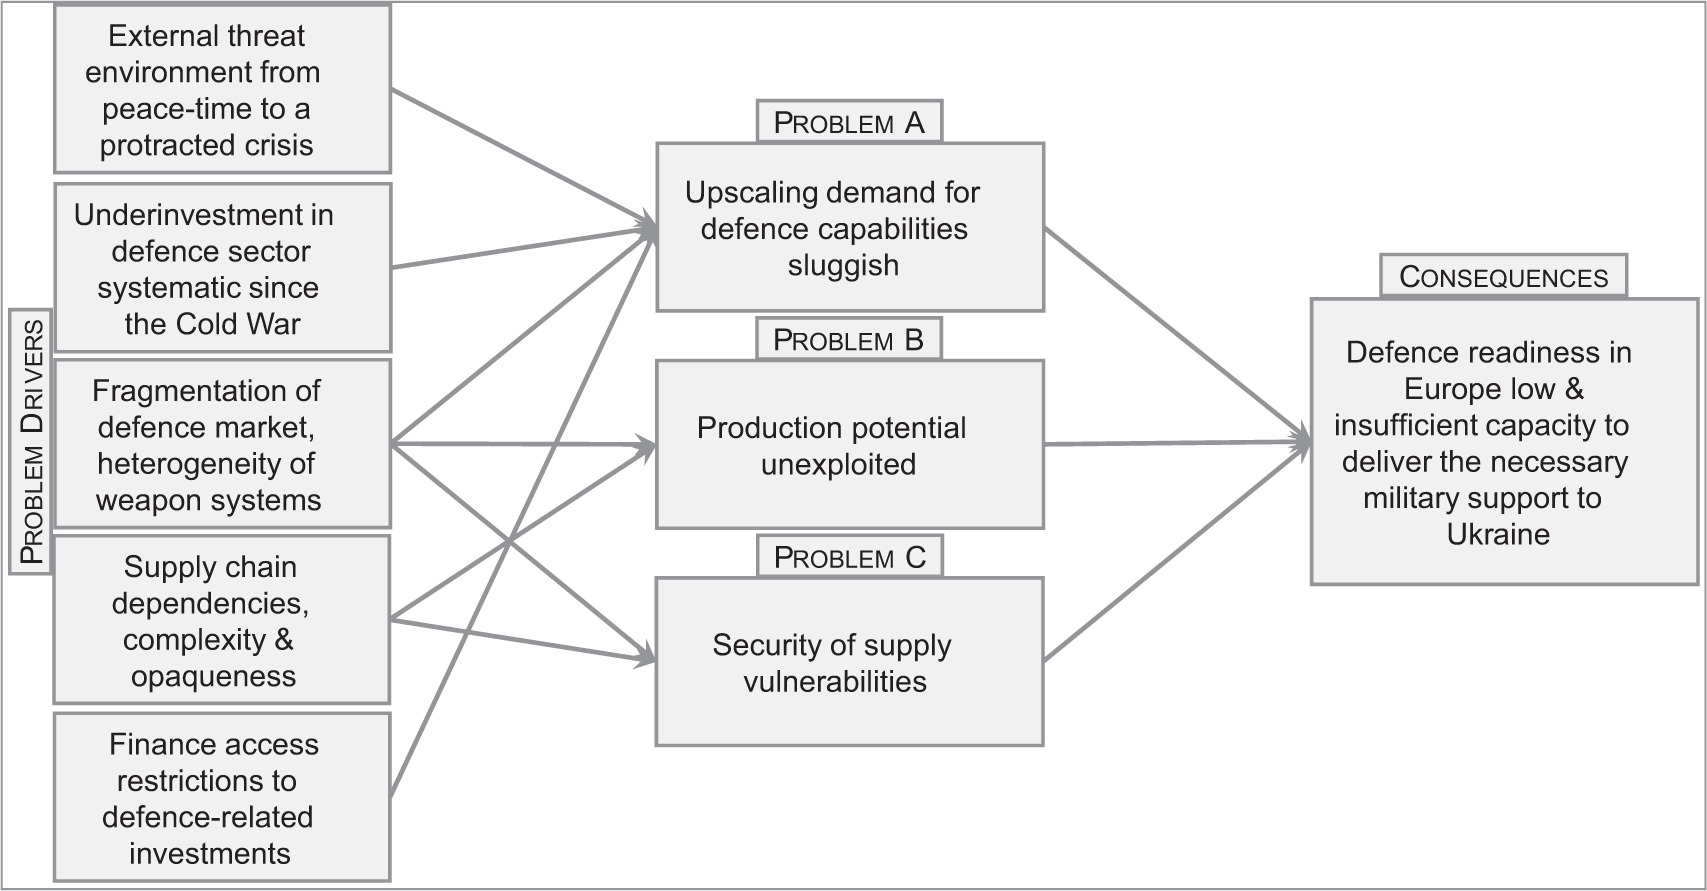
One of the key problems is “sluggish upscaling of demand for military equipment.” Indeed, most of the existing national preparedness and readiness strategies (great exceptions being Finland and Sweden) are oriented towards threats below the level of war, for instance, terrorism, natural disasters, cyber attacks, or loss of critical infrastructure (Galvin, 2022). While these approaches address a number of capabilities that would be useful also in times of a protracted crisis and war, such as mass care, security, first responders, and operational communications, a protracted conflict would require these capabilities to be expanded. This would inevitably lead to an intense competition over critical resources, such as people, raw materials, and production and distribution capacity (Campbell, 1952).
This study identified several drivers leading to a sluggish upscaling of demand for military equipment. First, decision makers are yet to acknowledge that a new and challenging security environment—with war having returned to the European continent—has different needs compared with a peace time environment in terms of adequate response. The European defence industry –oriented mainly toward cost minimisation– has a constrained capacity to respond to the structural change in the deteriorating security environment, which will prevail in the medium and long run (NATO, 2025). There is also the need to support Ukraine in defending itself against Russia’s war of aggression in the short run. Second, decades of underinvestment have left the European defence industry with limited production capabilities. Third, due to a fragmented and uncoordinated demand, the defence industry is typically tailored to the specific needs of narrow national markets (Mueller 2024). Fourth, supply chain bottlenecks affect production capacity and the possibility of effectively expanding production. Fifth, the reluctance of the European financial sector to provide financing to defence-related companies represents a significant constraint for the defence industry’s capacity to undertake the necessary investments (European Commission [EC], 2024).
The second identified problem is “unexploited production potential.” The key driver leading to the problem of limited exploitation of the true potential is fragmented and uncoordinated demand (Figure 1). The European defence market structure is highly imperfect. At the national level, the market reflects a mix of monopoly supply and monopsony demand, while at the European level, it is a complex amalgam of oligopoly supply and oligopsony demand. Small national markets in Europe are served in isolation following the prevalence of a “systematic bias in favour of a domestic solution” and “a domestically oriented organisation of defence R&D.” Defence industrial supply chains have been predominantly set up on a national basis. Access for new suppliers located in other member states remains limited, leading to low levels of cross-border engagement in the defence industry’s supply chains as evidenced by the Eurostat data on intra-EU trade. Although defence equipment procurement expenditures of EU member states increased by approximately 65% from 2017 to 2022, the value of intra-EU trade in defence-related products has not increased. In contrast, the intra-EU defence equipment procurement ratio to the total defence equipment procurement in the EU decreased from 22% in 2017 to 15% in 2022. For comparison, the ratio of the value of the overall intra-EU trade of goods and services to the EU GDP is around 47%. An increase in the European defence demand, however, does not show up in the European cross-border trade, indicating that member states prioritise their national industries and/or those of third countries. Thus, the defence fragmentation remains unsustainably high, not only at the level of downstream buyers but also at higher tiers of the defence supply chains. The fragmented demand is mirrored by the defence industry being largely divided along national borders in Europe (EC, 2024).
As the defence sector is demand-driven—governments are the only buyers of defence products—the fragmented nature of the relatively small domestic demands is reflected also by a fragmented defence industry. Four types of costs of non-integration (defence market fragmentation) in Europe can be identified (Kancs 2025a): (i) Monetary costs due to the duplication of national efforts. The resulting duplications prevent the industry from achieving optimal production levels because duplication increases costs, and by increasing costs, Europe is getting fewer weapons, ammunition for the budgets available. (ii) Failure to capture the economies of scale needed to produce vital equipment, such as ammunition, and potential learning effects. The foregone economies of scale may be substantial. The existing literature provides clear evidence of the expected positive impact of increased scale of production on the cost-effectiveness of the defence industry: cost reductions of 10–20% can be achieved when production is doubled or increased from minimum efficient scale to the ideal level (EC, 2024). (iii) Dependencies on non-EU sources of equipment. European countries tend to direct a very large proportion of their procurement outside of Europe. From a total of EUR 75 billion spent by EU member states between June 2022 and June 2023, 78% was procured from outside of Europe (EC, 2024). (iv) Lack of common military assets, which affects interoperability and leads to the emergence of capability gaps. By spending limited resources to develop similar capabilities multiple times, gaps may arise in other segments, in particular regarding capabilities requiring high investments that are not affordable at a national level.
The third identified problem relates to “security of supply vulnerabilities.” While the security of supply is not a major concern for most European countries during peace time, it may become a critical vulnerability in times of major crises and wars, as the functioning of international markets, including intermediate inputs, generally deteriorates in such contexts (stricter export control, higher demand, transport problems, weaponisation of global supply chains, etc.). Also, supplies for defence production, including delivery of defence products and services, may be significantly affected, or even disrupted. For example, access to imported critical raw materials—notably from China, which supplies 34% of all raw materials to the European defence sector—could be cut off during a global conflict; these issues are not addressed in the current preparedness and readiness strategies. Indeed, in 2023, China imposed export restrictions on gallium, germanium, and high-grade graphite (EC, 2024).
Two main drivers leading to security of supply vulnerabilities can be identified in Europe (Figure 1). One is the above-mentioned European defence sourcing fragmentation, which contributes to security of supply uncertainties, particularly during major crises and wars. Further, an insufficient understanding of European defence supply chains and dependencies on third countries for critical supplies and components imply significant vulnerabilities that cannot be addressed at the national level only (Kancs, 2024a). The fact that these vulnerabilities cannot be addressed at the national level can be considered as another driver of security of supply vulnerabilities. Although the security of supply is an issue of national competence in the EU, there is nonetheless an ever-stronger European dimension to the security of supply, as industrial supply chains are increasingly extending across national markets in Europe as well as globally (Kancs, 2024a). With the increasing cost and complexity of state-of-the-art capabilities in defence, no single European country can afford to develop, produce, and sustain on a purely national basis the whole spectrum of defence capabilities. The growing size and complexity of supply chains both vertically (the number of tiers in the supply chain) and horizontally (the number of intertwined upstream suppliers and downstream customers connected in each node) inevitably implies a limited knowledge and the overall understanding of supply chains and potential risks and vulnerabilities.
A major consequence of these three problems is a significant gap between the current European defence readiness to deliver on security needs (including the necessary military support for Ukraine) and the European defence readiness realities. This study’s situational assessment is broadly in line with the force readiness assessment of Monaghan et al. (2024), who conclude that although the Alliance outguns Russia several times over, European allies face a significant conversion challenge in translating their potential and power into required combat capabilities with the necessary speed, intensity, and agility. European forces face significant readiness gaps and mobility challenges in air force, army, and navy, which undermine the conventional deterrence (Kancs 2025a).
Defence enablers at the operational level
NATO (2025) and the White Paper on European Defence Readiness (JOIN, 2025) identifies cross-border military mobility as one of the key critical capabilities at the European level. To better understand the current state and the vulnerabilities that mobility gaps may imply for the security of citizens and the integrity of territory, this study examines the state of readiness on military mobility. The particular relevance of cross-Europe force mobility is based on the fact that the Alliance has considerably more members now than during the Cold War. Hence, European allies also have a considerably higher number of countries to defend along the border with Russia and Belarus, and the transport of brigade-sized troops and heavy equipment across Europe unavoidably involves a transit across many national borders. Ensuring that the forces are provided for and maintained in the areas of deployment is another challenging issue. Hence, the ability to move sufficiently large forces smoothly across national borders has become even more critical.
Military mobility is about “facilitating the movement of military troops and assets [which] is essential for the security of European citizens” (Directorate-General for Defence Industry and Space [DG-DEFIS], 2025). The master principle of military mobility concerns the ability of combat forces and their weapons to move expeditiously towards their objective, and for combat support and combat service support forces to maintain the fighting efficiency of such a force once engaged (Hodges et al., 2021). Two elements that are central to effective and efficient military mobility—speed of assembly and speed of engagement—are examined in the European context in this section.
The elements stated above served the Alliance’s capability—military mobility—during the Cold War period. An agile movement of forces and resources across the spectrum was a rather simple task during the Cold War, as European allies were trained to move military personnel and materiel around the Alliance fast and on short notice (Hodges et al., 2021). Similarly, the transportation infrastructure in Europe was well suited for military needs during the Cold War period. In Western Europe, dedicated traffic signs on all strategically important road bridges were bearing the image of a tank and a number. The signs signified the weight and gauge a given bridge could bear in the event of a major exercise or an emergency. Large-scale exercises, such as REFORGER, Lionheart, Able Archer, and Big Lift, were designed to test military mobility almost routinely. During the cross-border exercises, the commanders could well assume that the road, rail, air, sea, and port facilities, much of them controlled by civilian governments, would enable their respective forces to move rapidly and relatively securely (Hodges et al., 2021).
The assessment of the current state of cross-border military mobility suggests that moving forces across allies’ borders has become extremely complex and slow during the three post-Cold War decades in Europe. The suitability of transportation infrastructure for military needs has eroded significantly during the post-cold war period. The shift to a corporate culture with its focus on commercial cost and profit has led to entire infrastructures being constructed with no heed for their potential military use in an emergency. Although the detailed results of the situational assessment related to cross-border military mobility in Europe contain classified information and are not publicly releasable, the undertaken assessment points to a critically low force agility.
As evidenced by the Quadriga 2025–a multinational exercise with 14 nations and 2 brigade-size troops–the cross-border mobility of armed forces—needed to rapidly deploy forces across Europe to repel an attack by a “near-peer adversary,” such as Russia—presents severe structural challenges. As a result, a swift and seamless movement of military force and their equipment at short notice and on a large scale, enabling military personnel to react quickly to emerging threats at the Alliance’s external borders and beyond, is hardly possible currently.
The findings of this study are broadly supported by the assessment of the European Court of Auditors (ECA, 2025) and the European Parliament (EP, 2025). One EU member state currently requires a notification of 45 days in advance for cross-border military movement permissions. Tanks from one member state do not receive approval to move through another member state because their weight exceeds the limit set in road traffic regulations. In another cross-border exercise, heavy military equipment from one member state could not reach a military base in another member state because a bridge that was to be used could only handle light traffic. To complete the movement of forces and resources, a significant detour was needed. In another exercise, a detachment with armoured vehicles, equipment, and ammunitions had to be deployed from their barracks in one member state at the North Sea to another member state at the Black Sea coast. This involved the crossing of five borders by rail, road, and air. Despite the tiny troop size compared to a brigade, the practical problems encountered in this deployment were numerous, and the deadline of 5 days could not be met (ECA, 2025; EP, 2025).
All these direct and indirect pieces of evidence suggest that despite the political commitments, as expressed in the Conclusions of the 2025 Special European Council Summit on European Defence and Ukraine, the conversion of political will into operational needs is still behind what is required to “protect the security of its citizens, and the integrity of its territory” along the nearly 4,000-km land border with near-peer adversaries. A natural question arises: “Given that Europe has been facing a full-scale war for almost 4 years, why is the cross-border military mobility both within and across countries so low?” If Russia would attack a bordering NATO country, how allied forces would reach the attacked area in the Alliance’s eastern flank as fast as possible? In a war, every second matters.
As above, this question is approached in a structured way, and the key problems of military mobility, their drivers, and consequences on defence readiness are identified. They are mapped out in Figure 2, where four major issues of cross-border military mobility in Europe are identified. The main obstacles to a swift force and materiel movement include inadequate infrastructure, including bridges and tunnels, to move armoured military vehicles; lengthy and fragmented bureaucratic procedures, including national regulations and customs requirements as well as administrative processes involved in carrying military materiel across borders; a lack of transport capacity, such as rail cars; and vulnerabilities and incompatibilities in communication systems (Figure 2).
Figure 2.
Situational assessment of problems, drivers, and consequences of military mobility. Source: Based on ECA (2025) and EP (2025).
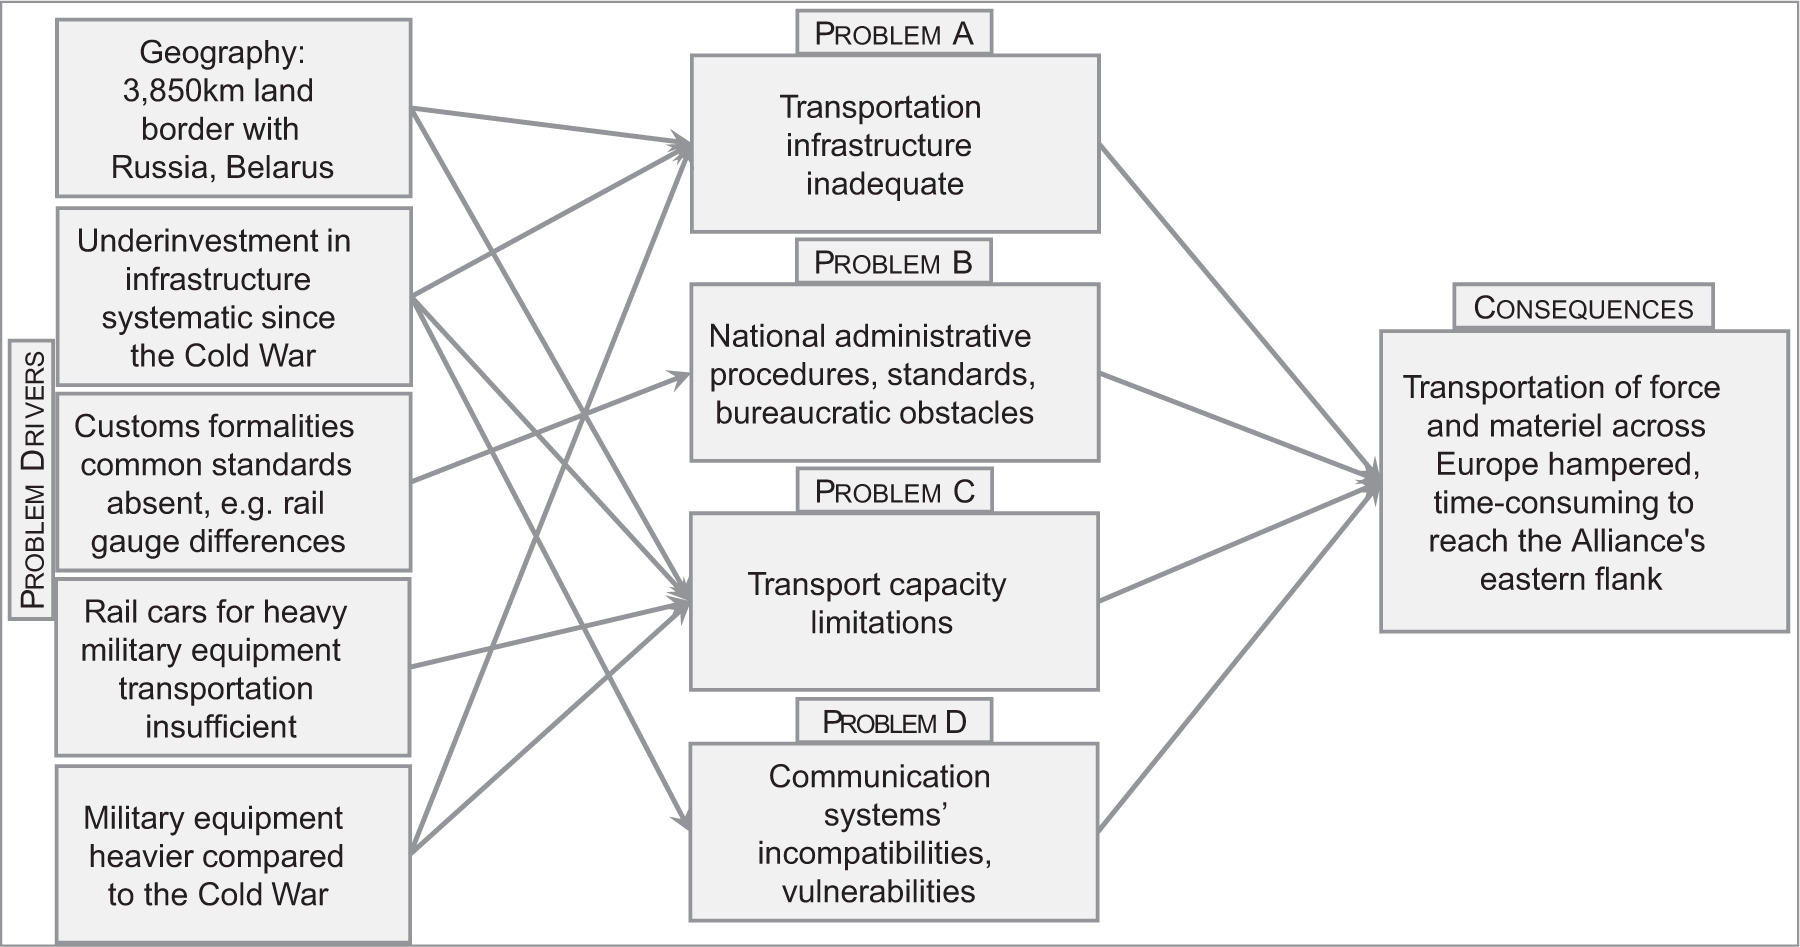
Looking into the drivers behind the identified military mobility challenges, the first observation is that shifts in Europe’s geostrategic Alliance have created new dynamics in geo-defence. Now that the Alliance shares 3,850 km of land border with aggressors, Russia and Belarus—longer than the US–Mexico border—the role of military mobility has increased dramatically. There are no more “neutral” countries, such as Finland and Sweden, between the Alliance and Russia, its main adversary in Europe. In addition, another 3,060 km of land border is shared by aggressors and Ukraine, a close Alliance partner and potential future member. These changes in Europe’s political geography, which constitute the first driver of the military mobility problem, have even increased the need to move sufficiently large forces smoothly within and across national borders in Europe.
The second key driver of the military mobility problem is that European allies have long underinvested in military mobility required for rapid deployment of forces across Europe (JOIN, 2024). The physical infrastructure needed, such as resilient rail systems and bridges strong enough to bear the weight of tank transporters, has largely been neglected during the decades of the post-Cold War peace period in Europe. Further, much of the rail infrastructure across Europe has been privatised, mainly to comply with EU competition and state aid rules. Also China’s growing presence in Europe, including its acquisition of critical pieces of European infrastructure, especially ports, has raised questions about the Alliance’s ability to receive reinforcements from across the continent and to move them across the theatre in an all-out crisis. As a result, closing the structural gaps and increasing the speed of military mobility requires a long time, given the rapidly evolving threat environment, which limits the force capability to respond with the necessary speed, intensity, and agility.
Further, Russia’s invasion of Ukraine exposed the Europe’s legal constraints and deficiencies in its transport networks, which limit the movement of troops and equipment across the continent. Since the Cold War, moving forces across countries in Europe has become entangled in a web of national regulations and customs requirements (Allen et al., 2021; Chihaia, 2025). In the short run, improving pan-European military mobility is challenging, because transport and customs rules are largely a national prerogative. Also, common standards are often absent across European allies (Allen et al., 2021; Chihaia, 2025). For example, the rail gauge in Finland and the Baltic states is wider than that of the other Nordic countries. This means that Norwegian and Swedish trains cannot run directly on Finnish and Baltic rails. Instead, they must stop near the border to unload and then transfer their cargo onto wider-platform trains to continue into Finland or the Baltics (Ottosson et al., 2024). Such unresolved technicalities reduce the speed of military mobility considerably.
Apart from the absence of a fit-for-purpose physical infrastructure and a non-aligned legal and regulatory framework, European rail operators do not have enough rail flatcars to transport heavy military equipment. According to Deutsche Bahn, the largest rail network operator in Europe, it has less than 10% of the rail flatcars that would be needed for military transport in the case of an armed aggression or war against European allies (Hartmann, 2024). In addition, many of the rail flatcars available for transport are limited to 70 tons, implying that they cannot carry a modern MBT. In addition, making arrangements for the heavy-duty flatcars to be available when the commander needs to move his armour division of MBTs around constitutes a logistical problem (Chihaia, 2025; EP, 2025).
Finally, compared to the Cold War period, both European and American tanks are considerably heavier now and trailers are bigger than they used to be four to five decades ago (Michta, 2022). Modern MBT’s typically weigh 70–80 tons, which is considerably more than the weight of tanks manufactured during the Cold War. Second- and third-generation tanks are much heavier due to the need for all around protection. Further, modern MBTs are heavy due to their armour and the need to support their cannons, which are very heavy. They have not only large guns and lots of equipment but also engines that can perform different manoeuvres; these tanks are very agile. For example, the M1 Abrams, produced in the 1980s, weighed around 60 tons, so it was relatively easy to transport around Europe, without requiring much in the way of special cars. However, the Abrams has slowly put on weight in the years since then, and the current iteration, the M1A2SEPV3, weighs around 74 tons fresh out of the factory, and with aftermarket add-ons can reach 80 tons (Stockholm International Peace Research Institute [SIPRI], 2025).
A direct consequence of these problems of cross-border military mobility is that allied forces take far longer to deploy and withdraw than they should if they are to afford the required deterrence and defence at the speed of relevance.
CRINK scenario simulation
The primary aim of scenario analysis is to future-proof the Alliance’s strategic decision maker options, making them resilient to changing boundary conditions. To stress-test Europe’s strategic readiness, this study leveraged the EU-EMS model (Kancs 2024b; Kancs 2025a) and undertook a simulation analysis of a selected worst-case scenario, based on NATO’s Strategic Foresight Analysis 2023 (SFA23) and Future Operating Environment 2024 (FOE24).
Methodology
To study how global shocks triggered by CRINK are transmitted to NATO allies’ prices, production, consumption, trade, and defence industry in the presence of global cross-border multi-stage production networks, this work relied on an empirically parameterised and validated global model of Kancs (2024b), which was adopted to capture the general equilibrium effects of global value chains, as in Kancs (2024a). Sectoral heterogeneity is an important dimension in this study’s analysis, as the impacts of bilateral trade cost changes differ across countries, depending on the sectoral composition of their economies and the relative dependency on different foreign markets. This modelling framework makes it possible to explore the impacts of shocks on prices, production, consumption, and the welfare of countries through the reorganisation of the global capability centres (GSCs) they are involved in.
The world economy considered here is perfectly competitive, consisting of J countries, indexed j = 1, ..., J and S sectors, indexed s = 1, ..., S. Country j’s consumers and firms source sector s’s final and intermediate goods from the lowest price supplier across all countries. Consumer preferences in country j are characterised by the utility function:
where Csj is the consumption of good j supplied by sector s, and ∝SJ is the sector’s share in expenditure with
where yjs(ωS) is output, zjs(ωS) is total factor productivity capturing firm technology, ljs(ωS) is labour input, and Mjrs(ωS) is a Cobb–Douglas composite of intermediate inputs from all sectors with shares γjrs for r = 1, ..., M, such that
Sector s’s composite product Qjs is a Constant Elasticity of Substitution (CES) aggregate of its goods over the unit interval:
where σs is the elasticity of substitution between sector s’s goods, and qjs(ωS) denotes the quantity of product ωS that is ultimately purchased from the lowest price source country. The equilibrium of the model can be found by maximising utility subject to the unit cost function, Cjs, associated with 1:
where Ƴ is a constant that depends only on γjrs for r = 1, ..., M, wj is the wage rate of labour, and Pjrs is the price index of intermediate inputs:
Analogously, the price index of final goods F, can be expressed as follows:
These price indices depend on technologies, Tsj, unit costs, cri, and trade costs, τijrs, between origin country, i, and destination country, j. Trade costs are of the iceberg type with τijrs ≥ 1 measuring the number of units of a good produced by sector r for use in sector S that have to be shipped from country i to country j for one unit to arrive in the destination. Fraction τijrs – 1 of the transported good is used to pay for transportation. The price indices also depend on sector-specific productivity dispersion parameter, θr.
In equilibrium, the shares of intermediate goods of sector s in country j sourced from sector r in country i are given by:
and the corresponding shares of final products of sector F in country j sourced from sector r in country i are given by:
which themselves depend on technologies, TjS, unit costs, cjS, and trade costs, τijrs, of countries i and j. They also depend on the productivity dispersion, θr. These parameters can be interpreted as sector-specific trade elasticities as they measure (in absolute value) the percentage fall in a sector’s bilateral trade due to a 1% increase in the bilateral iceberg trade cost.
The model is closed by two sets of market clearing conditions and a trade balance condition. The first requires that for country j the total expenditure, XjS, satisfies:
where Dj denotes the trade deficit so that the two terms on the right-hand side correspond to total expenditures on the country’s intermediate and final products, respectively. The second market clearing condition requires that the total output, Yjr, satisfies:
where the two terms on the right-hand side correspond to the country’s total output levels of intermediate and final products, respectively.
The trade balance condition requires that country j’s aggregate imports equal the aggregate exports plus it’s trade deficit, Dj:
Finally, the equilibrium is defined by the following system of equations: J × S equations of the unit cost function, cjs; J × (J – 1) × S equations of the price index of intermediate inputs, Pjrs; J × S equations of the price index of final demand goods, Pijrs; J × (J – 1) × S × S equations of the shares of intermediate inputs, πijrs; J × (J – 1) × S equations of the shares of final demand goods, πijr,F; J × S – 1 equations of the total output, Yjr; and J equations of the trade balance condition. With this system of equations, this study seeks to solve for the following unknown variables: J × (J – 1) × S × S independent intermediate goods trade shares, πijsr; J × (J − 1) × S independent final goods trade shares, πijr,F; J × S unit production costs, cjs;J × S × S intermediate goods price indices, Pjrs; J × S final goods price indices, pjr,F; J – 1 wage levels, wj (one is a numeraire); and J × S is gross output levels, Yjs.
The high dimensionality of the model— [J × S] + [J × (J – 1) × S] + [J × S] + [J × (J – 1) × S × S] + [J × (J – 1) × S] + [J × (S – 1) × [J] equilibrium equations need to be solved simultaneously—implies that solving the model is computationally demanding. To reduce computational burden, this study solves the system of equilibrium equations for the effects of a change in trade cost on wages, output, and prices differently. Applying goods market-clearing and trade balance conditions enables the derivation of results for changes in the variables of interest without knowing the initial levels of the target variables. In this “hat algebra” approach, the only needed data are as follows: the intermediate input and final demand goods trade shares, πijrs and πijr,F, and the intermediate input and final demand goods expenditure shares, πjrs and αjs. Further, for parameterising the model, the values for trade elasticities, θs, are needed, and for operationalising the trade policy shock in the model, information on changes in trade costs is required.
The intermediate input and final demand goods trade shares, πijrs and πijr,F, and the intermediate input and final demand goods expenditure shares, πjrs and αjs, are computed from the World Input-Output Tables (WIOT) and Inter-Country Input–Output (ICIO) data. Each entry of the World Input-Output matrix represents a country-sector pair, for instance, how much each sector in Italy spends on intermediate input and final demand goods from each sector in China. To illustrate the type of bilateral trade data detailed in the model, we can think of an input-output table of a simplified world economy. The table consists of two panels, for intermediate inputs and final goods. This distinction is crucial for (i) computing the actual trade costs, including tariffs, and (ii) mapping the observed input-output linkages into the model. This richness of the World Input-Output trade data makes it possible to determine the impact of systemic shocks on each sector within each country.
The most influential parameter in EU-EMS, as in most open economy macro models, is trade elasticity, which determines substitution of defence and other sectors’ across goods from different origin countries. Therefore, elasticity estimates are drawn from econometric literature (Imbs and Mejean, 2017). In line with the importance of elasticity in trade literature, assumptions about trade elasticity have the largest impact on the underlying model estimates. The elasticity of substitution of traded goods from different origins determines the ease and speed with which trade can be reorganised, for example, away from countries which have imposed export bans or increased import tariffs. If trade elasticity is low, it is hard to find alternatives for existing imported goods, and the welfare loss of cutting the trade link is high. If the elasticity is high, substitution is easier, and welfare costs are much lower. In line with literature estimates Imbs and Mejean, 2017, it seems plausible to assume that the relevant trade elasticities are larger in the medium- and long run, and smaller in the very short run. This time-dependency of trade elasticity implies that the size of economic losses stemming from a sharp increase in trade costs with certain trading partners and the following reduction in trade flows depend crucially on the time frame over which adjustments take place. This is the reason why this study projects smaller adverse impact for the Alliance in the long run than in the short run.
Baseline
The first step is to construct a baseline defence industrial capability in Europe, against which the impact of a non-kinetic geopolitical conflict with CRINK will be measured. Following Kancs (2025a), the ability of existing and surge production capabilities to replace weapon inventories destroyed in the event of a prolonged conflict was computed. The methodology of Cancian et al. (2020) was followed, which allows the computation of the defence industrial capacity for replacing existing stockpiles. The time taken to replace inventories is used as a metric for the ability of the defence industrial base to meet the demands of a protracted conflict. The inventory replacement time, IRw, in years is calculated as follows:
where IOw denotes inventory objective of weapon system, w; YRw is the industrial production rate, and YRL denotes production lead time. To compute the replacement time of current inventories in Europe, the data on defence industry stockpiles and per-unit production rates are needed. The inventory data from SIPRI (2025) was used, complemented with data from IISS’s military balance (2025). The defence production rates for individual weapon systems are based on the US production data from the defence industrial production database (Cancian et al., 2020), as no comparable estimates are available for European manufacturers. Note that the United States has been spending on defence consistently more than European allies. Hence, the following calculations represent a lower bound (optimistic); the real inventory replacement times are likely to be considerably higher in Europe.
Table 3 reports the computed time in years necessary to replace the inventories estimated on the basis of the existing production capacities at economical and maximum production rates. As in Cancian et al. (2020) and Kancs (2025a), economical production rate is defined as the most efficient peace-time production rate for each budget year at which the weapon systems can be produced with existing plant capacity and tooling, with one shift running for 8 hours a day and 5 days a week. Maximum production rate is defined as the maximum capacity rate at which a manufacturer can produce with existing tooling and the maximum number of shifts that is feasible. The results summarised in Table 3 (left panel) reveal that the average replacement time for different weapon systems is rather high in Europe even in a peace time environment, and certainly so in view of a looming protracted conflict with CRINK.
Table 3.
Average replacement time (years) of current (2024) inventories in Europe and threshold attrition rate (percentage). Source: Computations based on the data from Cancian et al. (2020), IISS (2025), and SIPRI (2025).
Table 4.
Average replacement time in years (% change) of inventories in Europe following a complete cessation of trade with CRINK. Source: Computations based on the data from Cancian et al. (2020), IISS (2025), and EU-EMS model simulations.
As expected, mission support and command, control, communications, computers, and intelligence (C4I) systems have shorter replacement times because, partially, they have analogues in the civilian manufacturing sector (2nd row in Table 2). In contrast, navy ship systems, space-based systems, missiles and ammunitions, and aircraft and related systems are characterised by long replacement times. Navy ship systems and space systems have long replacement times because aircraft carriers and satellites are not built on assembly lines but are, instead, fabricated individually, which applies equally to the maximum production rate. These results from the computed defence industrial readiness in Europe will serve as a benchmark against which to measure the results of the “Cold War 2.0” scenario analysis.
Table 3 (right panel) also reports a threshold attrition rate in percent for different categories of weapons. The attrition rate is defined here as the percentage of the force and materiel lost because of combat attrition for each period of fighting. To compute the threshold attrition rate, the methodology of Stoll (1990) was followed. In line with the definition of European defence readiness—a steady state of preparedness—the defending force (European allies) aims at a withdrawal rate of zero and can hold its position until the threshold attrition rate is exceeded. At that point, the defending force has to withdraw, and the security of its citizens as well as the integrity of its territory and critical assets or infrastructures cannot be ensured anymore. It was estimated during the Cold War that NATO could suffer in the worst case up to 3.5 % attrition per day (Stoll, 1990). For comparison, the threshold attrition rates in Table 1 are computed on annual basis. The gap between threat realities and defence industrial capacity is evident.
Scenario construction
To assess the impact of global shock triggered by CRINK on the European defence readiness, this study relied on worst-case scenarios generated in NATO’s SFA23 and FOE24 exercises. It is acknowledged that the future is defined by random shocks that can confound strategic decision makers and lead to abrupt changes in policy direction. An examples of a systemic shock with particular relevance to defence in the last few years includes the COVID-19 pandemic. Further, the transition from one conflict to another through time can also be considered as a sequence of shocks on a smaller scale. To model future uncertainty formally, the approach of Ilut and Schneider (2023) or Kancs (2024b), who explicitly modelled risk and ambiguity could be considered—a promising avenue for future research.
In line with the SFA23 and FOE24 systemic shock scenarios, this study examines likely future boundary conditions by selecting a subset of representative scenarios for deep investigation in the European context. This study, which is inherently limited in scope, does not analyse every potential strategic shock identified in SFA23 and FOE24. Instead, it selects few distinct potential shocks that are scoring high on both likelihood and potential impacts and illustrates how mobilisation readiness and military mobility readiness perform in these scenarios of systemic shocks. Due to space constraints, this study presents the simulations of one compound scenario of a non-kinetic geopolitical conflict with CRINK—“Cold War 2.0”—which assembles changing boundary conditions from several SFA23/FOE24 scenarios: “Isolated states conducting disruptive strikes against digital and economic global systems causing global shock in telecommunication, supply flows and industrial activity”; “confrontation over limited resources (‘resource wars’) expanding to regional and global levels, attracting major powers or security coalitions”; “major supply chain shock resulting from regional conflict, denied access to resource nodes, or severe trade prohibitions”; and “formation of a military alliance, openly adversarial to NATO.”
To operationalise the Cold War 2.0 scenario (Kancs 2025b) in the EU-EMS model, the study simulates a complete cessation of trade between the “Alliance/partners” (32 member countries plus 37 NATO partners) and CRINK (China, Russia, Iran, North Korea). The rest of the world (ROW, consisting of all other countries) is modelled as “neutral.” All trade flows in final demand goods, intermediate goods as well as raw materials with CRINK are disrupted in the Cold War 2.0 scenario. In the model, prohibitively high trade costs are implemented between members of the Alliance/partners and CRINK, so all trade flows between the two Cold War 2.0 “blocks” drop to zero. Other bilateral trade costs (e.g., between the Alliance members and the rest of the world countries) are left unaltered, and trade flows between all these trading partners will adjust endogenously.
This study notes the hypothetical and extreme nature of NATO’s SFA23/FOE24 scenarios. However, the insights gained from this analysis offer valuable perspectives on the civil, military, public, and private forces at play, and their interactions both within countries as well as globally. Moreover, by examining such extreme scenarios, the study aims to delineate the boundaries of possible outcomes and provide a worst-case perspective on the issue. The study does not speculate on what events might trigger such scenarios nor does it takes a stance that this is a likely or desirable outcome.
Simulation results
Using the EU-EMS model of Kancs (2024b), the Cold War 2.0 scenario developed in the previous section was simulated. To improve the decision maker’s understanding of which additional challenges would defence preparedness face in such a worst-case scenario, and what could enhance European defence readiness, this study simulates the Cold War 2.0 scenario using alternative courses of policy action and compares the impacts on defence industrial production in Europe. Specifically, the study investigates two alternative policy choices: a rapid trade diversion from CRINK, and a moderate trade diversion. The rapid trade diversion policy is a robust and pro-active trade policy, which entails effectively engaging with multilateral, regional, and bilateral trading partners and opening up new markets and sources of inputs swiftly. The rationale for the moderate trade diversion (status quo) lies in the assumption that the global shock triggered by CRINK may be a short-lived temporary shock; hence, a costly trade diversion can be avoided. This scenario fosters internal resource relocation towards defence readiness-related activities, while it leaves the shaping of post-shock international trade patterns fully to market forces.
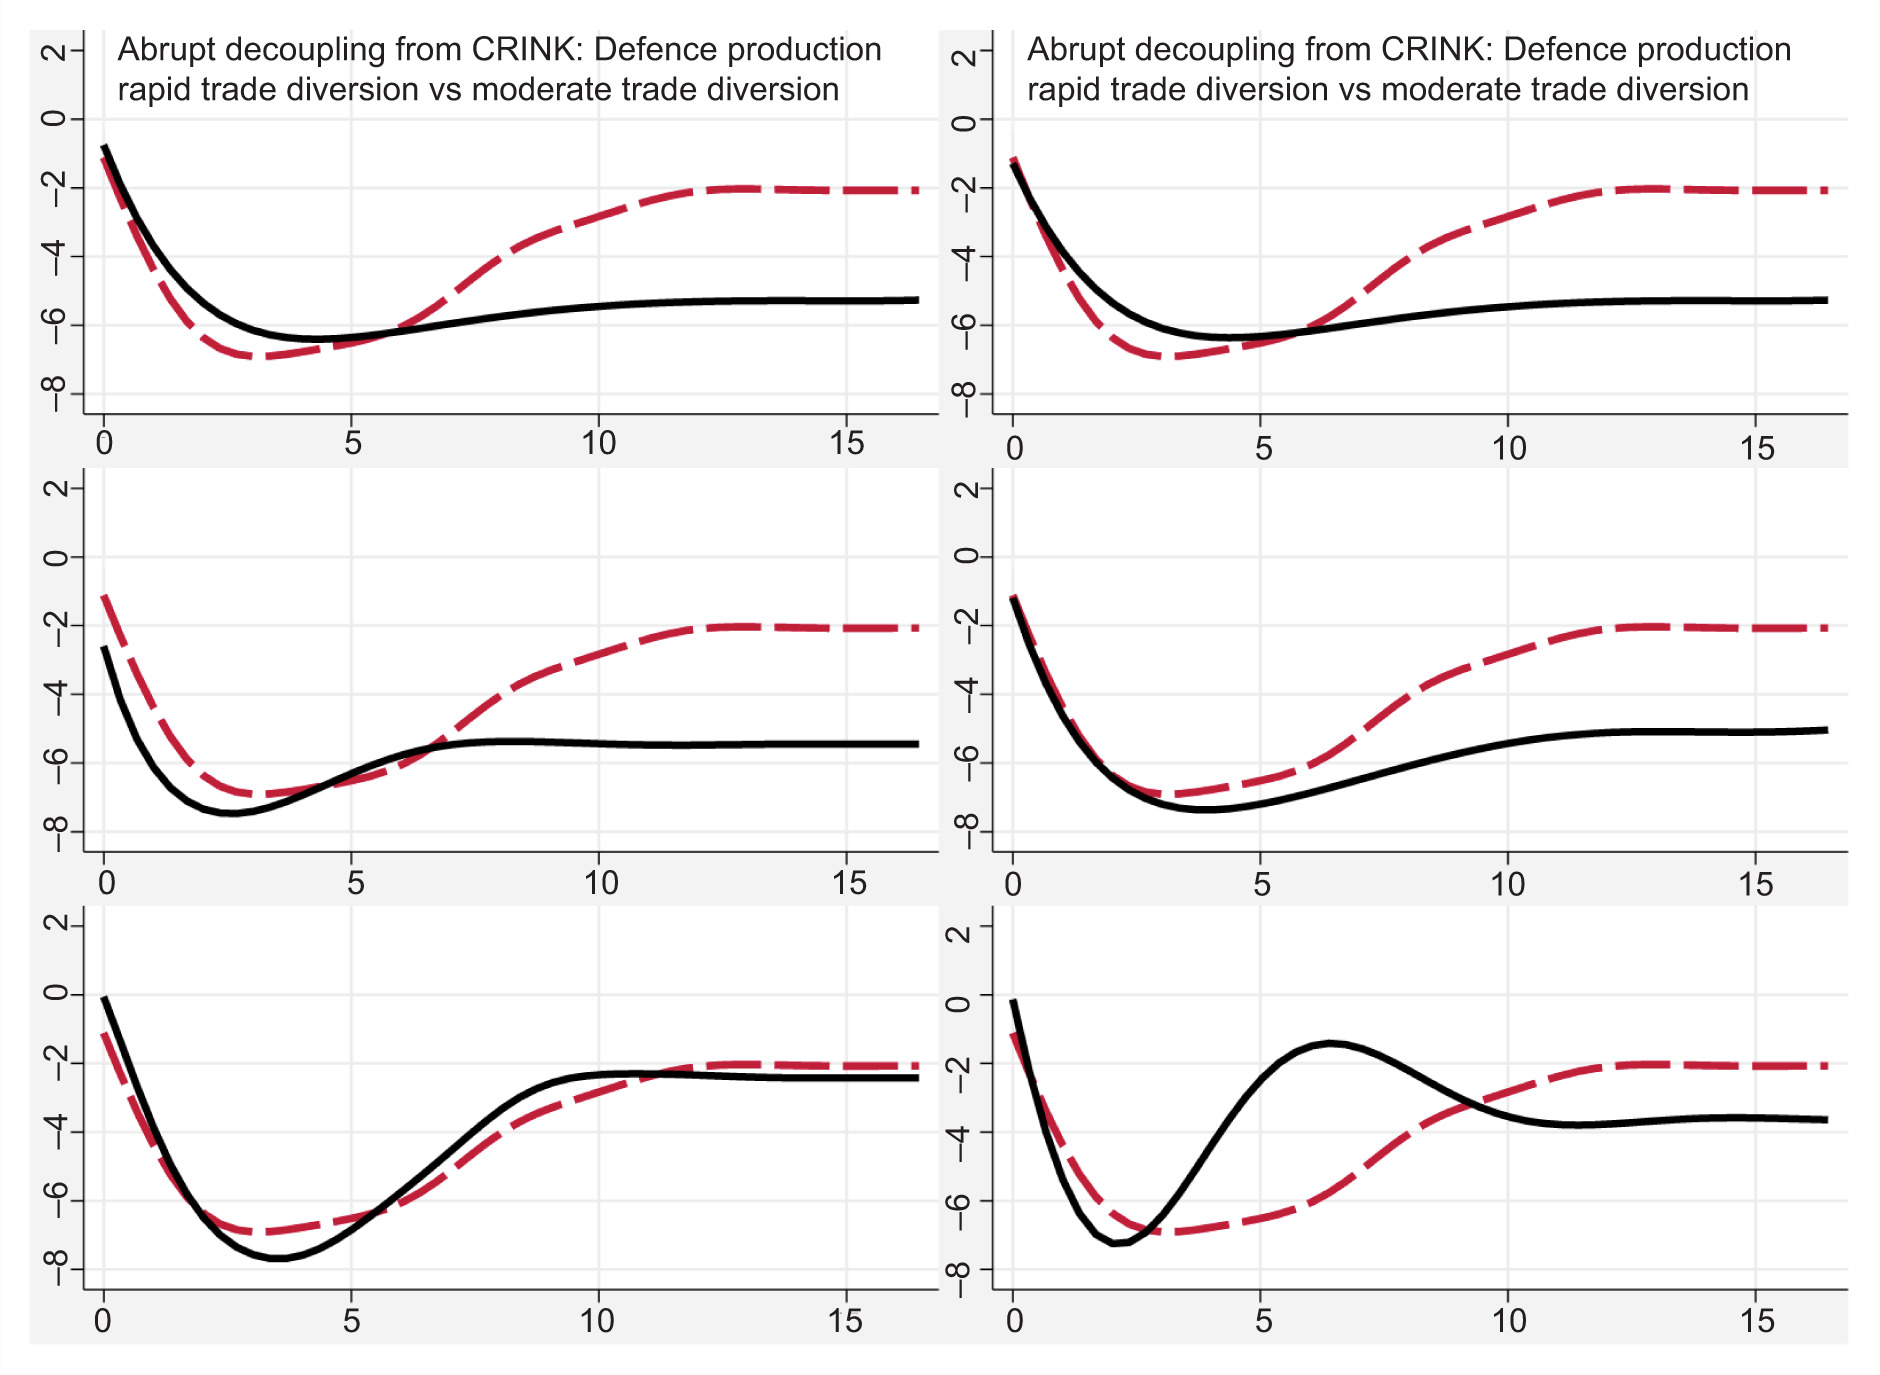
Figure 3 reports the simulation results of an abrupt trade decoupling from CRINK regarding the aggregated European defence production. Results for different reasonable model parameter assumptions are reported as a percentage change compared to baseline. The main simulation results (upper left panel in Figure 3) imply that in the short run (3–4 years), the defence industrial production in Europe would suffer sizeable losses, amounting to 7.3–7.4% per year (Figure 3). In the medium- to long term, international trade will be reoriented towards trade within the Alliance/partners, and the adverse impact of decoupling from CRINK on the European defence industrial production will be dampened (2.4–5.2%). Overall, our simulation results of abrupt decoupling from CRINK under a wide range of model parameter settings, as reported in the 6 panels in Figure 3, robustly point to substantial losses in the aggregated European defence production, particularly in the short run. These are additional challenges on top of existing ones Europe would face in a worst-case scenario, as simulated above.
Figure 3.
European defence industrial production (% change) following an abrupt decoupling from CRINK. Source: Simulations based on the EU-EMS model.
The main impact on the defence industrial production in the EU-EMS model is channelled through supply chains of intermediate goods and raw materials from China, as the manufacturing of weapon systems and equipment in the Alliance uses Chinese intermediate goods as well as raw materials as inputs (Kancs 2024a). Disrupting these supplies of intermediate goods and raw materials to European defence manufacturers abruptly would result in a sizeable negative output shock. The defence sector’s input sourcing dependency on other CRINK countries is considerably lower.
To evaluate the defence industrial readiness under the Cold War 2.0 scenario, this study related the simulated “post-shock” shortages of intermediate input and raw material supplies to the European defence industrial capacity. Specifically, the study used the maximum production rate per weapon system and re-computed the replacement rates of current inventories (Table 3) with the reduced defence industrial production due to a complete cessation of supplies from CRINK (Figure 3). While these results are informative about the channels of adjustment linking the European defence industry to global supply chains, when interpreting the results, it has to be kept in mind that the actual magnitude of defence production effects will be specific to each manufacturer, weapon system, and plant location. This study used the simulated average impacts in calculations to circumvent the absence of such detailed information.3
The results suggest that if all made-in-China parts and other CRINK components were excluded from European weapon system manufacturing supply chains, on average, the replacement time of current inventories of weapon systems would increase significantly (‘unanticipated’ columns in Table 3). On the other hand, negative effects on defence industrial readiness would be dampened if the shock is anticipated, that is to say, governments agree on trade policy measures in advance (anticipated shock).
The expansibility of the defence industrial capacity in the Alliance is heavily dependent on strategic competitors, who are difficult to substitute in the short run (Kancs, 2024a). The simulation results suggest that the current structure and capacities of the European defence industry struggles to respond effectively and with agility to challenges imposed by a non-kinetic geopolitical conflict, as simulated in the Cold War 2.0 scenario. In the case of a complete cessation of intermediate goods and raw material supplies from CRINK, the European defence industry would struggle to replace most weapon system inventories with the speed of relevance. Even at maximum production rates, replacement would take many years, although weapon systems with civilian analogues can be replaced faster.
Feedback for strategic decision makers
Given the deteriorating security environment and rising tensions with CRINK, it is important for NATO allies to build up sufficient deterrence capacity to prevent a potential war of aggression in the first place. To credibly deter a foreign armed aggression, NATO allies need to have the capabilities necessary to conduct the entire spectrum of military tasks. Currently, most European allies suffer from critical capability gaps that affect the execution of military operations in a full-scale high-intensity war, such as Russia’s war against Ukraine, over a sustained period. As expressed in the NATO (2025) and JOIN (2025) communications, the Alliance needs to enhance its defence readiness in Europe in the shortest possible timescale.
Based on the findings, this study proposes a number of policy recommendations for enhancing the NATO defence readiness in Europe. In order to address the issue of sluggish upscaling of demand for military equipment, first, strategic decision makers need to accept that a new and challenging security environment—with war having returned to the European continent—has different needs, compared to a peace time environment, and respond adequately. Second, the systematic underinvestment in European defence has to be corrected soon, to develop the necessary capabilities and military readiness to credibly deter armed aggression and secure our own future, a massive increase in European defence spending is needed. While during the Cold War, the ten analysed “old” allies spent between 4.1% and 5.3% of GDP on defence, in 2024 the defence share in GDP ranged from 1.3% in Belgium to 2.3% in the United Kingdom. As agreed at the 2025 The Hague NATO summit, the allies will have to expand defence budgets in the order of those of the Cold War in order to ensure the necessary deterrence and defence capabilities. Third, a defence market integration and a coordinated cross-border demand is needed in Europe in order to move away from a largely fragmented defence industrial setup that is tailored to the specific needs of narrow national markets. This is an area where a cross-border cooperation can make a legitimate difference: defence procurement. Creating a single market, especially for industry, is something the European allies are particularly good at, and it is urgently needed in the fragmented European defence industry. Fourth, supply chain bottlenecks that affect production capacity and the possibility of effectively expanding production need to be addressed. For example, nitrocellulose, the main ingredient of gunpowder, is supplied largely (78.5%) by China to European defence manufacturers; China is also the largest exporter globally. These supply dependencies imply that currently the scaling up of European production of explosives, in response to geopolitical events, largely depends on CRINK. Fifth, the reluctance of the European financial sector to provide financing to defence-related companies needs to be addressed, as it is a significant constraint for the defence industry’s capacity to undertake the necessary investments.
To deal with the unexploited production potential problem, first, the underlying drivers need to be tackled. To deal with a fragmented and uncoordinated demand, both the defence fragmentation at the level of downstream buyers and at higher tiers of the defence supply chains need to be addressed. Further, there is a need to improve knowledge about suppliers of suppliers and the overall understanding of supply chains and potential risks and vulnerabilities. This is particularly important in the context of the growing size and complexity of global supply chains, both vertically (the number of tiers in the supply chain) and horizontally (the number of intertwined upstream suppliers and downstream customers connected in each node).
In order to address issues associated with security of supply vulnerabilities, the drivers leading to this problem need to be tackled first. Addressing the defence sourcing fragmentation in Europe will also reduce the security of supply uncertainties, particularly during major crises and wars. Improved understanding of European defence supply chains and dependencies on third countries for critical supplies and components will reduce foreign sourcing vulnerabilities. Although the security of supply is a national competence in the Alliance, there is nonetheless an ever-stronger European dimension to the security of supply, as industrial supply chains are increasingly spanning across national markets in Europe as well as globally.
Efforts to ease military movements and enhance preparedness for emergency by removing the key obstacles to a swift force and materiel movement could focus on improving dual-use infrastructure, including bridges and tunnels, to move armoured military vehicles; reducing and integrating bureaucratic procedures, including national regulations and customs requirements, as well as administrative processes involved in carrying military materiel across borders; increasing the transport capacity, such as railcars; and addressing the vulnerabilities and incompatibilities in communication systems.
The findings suggest that to ensure a rapid deployment of troops and military assets across Europe, the drivers behind the military mobility problem need to be tackled. First, an updated military mobility concept in the Joint Communication on Military Mobility is needed to consider new realities, such as the significant increase in the length of the land border that the Alliance shares with Russia and Belarus since the Cold War. Second, the systematic underinvestment in military mobility needs to be corrected by investing in both within and cross-country military mobility. Efforts to improve pan-European military mobility could focus on harmonising and simplifying transport and customs rules, which are largely a national prerogative. In the medium run, also, common standards across European allies need to be agreed and implemented. Further, in order to move equipment via rail, heavy-duty rail flatcars are required, and their numbers need to be increased substantially in Europe. Both transport infrastructure and means of transportation need to be updated to modern standards, as they are considerably heavier and larger than they used to be during the Cold War.
Allies are already making important progress in advancing military mobility on the European continent: identifying bottlenecks, designing strategies, setting new priorities, and placing military mobility at the forefront of the debate about enhancing European defence readiness. The so-called “military Schengen” agreement (MSA)—a new European initiative aimed at streamlining troop mobility among participating states—could become a framework towards strategic mobility priorities in Europe. In 2024, the Netherlands, Germany, and Poland launched a trilateral initiative to develop a military corridor for the movement of forces from Europe’s North Sea ports to the eastern flank. Aimed at moving military personnel and materiel more quickly and efficiently across national borders, the MSA is tackling military transport choke points, such as low or weak bridges (tanks weigh a lot more than they used to) and the bureaucracy that requires permits to move munitions across borders. The MSA will also give priority when needed to military rail requirements over civilian traffic. If implemented at the speed of relevance, the military Schengen initiative could become a good example for other NATO member countries as well as for the unification of military mobility procedures throughout the Alliance. A Europe-wide network of land corridors, airports, seaports, and support elements and services would ensure a seamless and fast transport of troops and military equipment across Europe.
Limitations
This study has a number of limitations, which need to be kept in mind when interpreting the results. Most of the limitations are related to the lack of internationally comparable and publicly available data for the defence sector. In order to conduct a causal analysis linking causes and consequences of readiness statistically, detailed production data on defence manufacturing, at least at a six-digit product level that preferably covers both national and international input and output transactions, would be required. Such data would make it possible, for example, to estimate the relationship between inputs (defence investment), intermediate goods (defence capabilities and capacity), and “final” output (security for citizens) with statistical tools. These issues are understudied in the current international security literature. Collecting such data and leveraging them for a defence readiness analysis in Europe offers a promising avenue for future research.
Further, the causes of the conversion challenge faced by the allies are worth exploring deeper. In order to achieve the desired effect on adversaries, the political commitments need to be converted into defence capabilities, which NATO allies’ leaders presume will influence the behaviour of Russia, for example, and yield the desired strategic effect. The conversion of allies’ latent power into inputs (defence investment), then intermediate goods (capabilities and capacity), and “final” outputs (security for citizens) lacks traction currently. Therefore, it would be important to understand conversion obstacles and identify the most effective and efficient strategies for addressing them.
Conclusions
This study aimed to answer three questions: How prepared are NATO allies in Europe to cope with a protracted conflict and war? Which additional challenges would allies face in a worst-case scenario? What strategies can enhance European readiness? The analysis was guided by NATO (2025) and the White Paper on European Defence Readiness 2030, which outlines the key defence issues in Europe—including critical capability gaps of forces; challenges of the defence industry, such as fragmented defence market; and military mobility—and provides a framework for ReArm Europe. A contemporaneous assessment of the preparedness of Europe for a protracted conflict and war made it possible to identify the state of readiness that Europe faces currently. The White Paper also underlines the need to strengthen the European defence readiness for worst-case scenarios. Hence, the study analysed one such hypothetical worst-case scenario to examine the resilience of the European defence readiness to changing boundary conditions. Comparing alternative courses of policy action enabled the identification of the most effective and efficient strategy to enhance readiness.
To evaluate the preparedness of Europe to cope with a protracted conflict and war, this study leveraged historical and latest defence data on Europe in a contemporaneous statistical analysis. The findings of the situational assessment revealed critical capability vulnerabilities in the European defence readiness currently. Both the examined defence capabilities at the tactical level and cross-border military mobility contribute to vulnerabilities in the overall European defence readiness.
To stress-test the European preparedness and readiness in a hypothetical worst-case scenario, an empirically validated mathematical model EU-EMS was leveraged. The simulated worst scenario analysis results suggest that today’s existing problems of the European defence readiness will only be amplified in the simulated global shock triggered by CRINK. By quantifying the potential cost of unpreparedness, this study provides a measurable rationale for European allies to embark on a rapid de-risking trajectory, rather than waiting for a much more costly, abrupt shock trigger dictated by increasingly unpredictable CRINK.