
Introduction
As a result of the dynamically changing operational environment due to the dynamic development of technology, the information society has a dominant and growing dependency on information and communication technologies (ICTs), resulting in an IT service portfolio that considerably affects value for shareholders (Sun et al., 2021). In parallel, this dependency has created an increasing need for working in a secure environment. Therefore, legislation requires all relevant entities to plan and design security controls that include preventive and reactive controls in a risk-proportionate manner in relation to the protected business value.
Selecting the specific security controls from the possible set of control mixes to be implemented is far more complicated than it looks at first. Those that have a negative impact on the given IT system’s usability and functionality are unacceptable. Considering this fact, one must choose one of the possible control mixes that comprises the proper preventive, detective, reactive, and compensatory controls, which do not endanger the business operation. On the other hand, the implemented controls must support the preventative or reactive capabilities in the right way to provide the required level of security and ensure the confidentiality, integrity, and availability of the IT services and the processed data and prevent and react to security incidents.
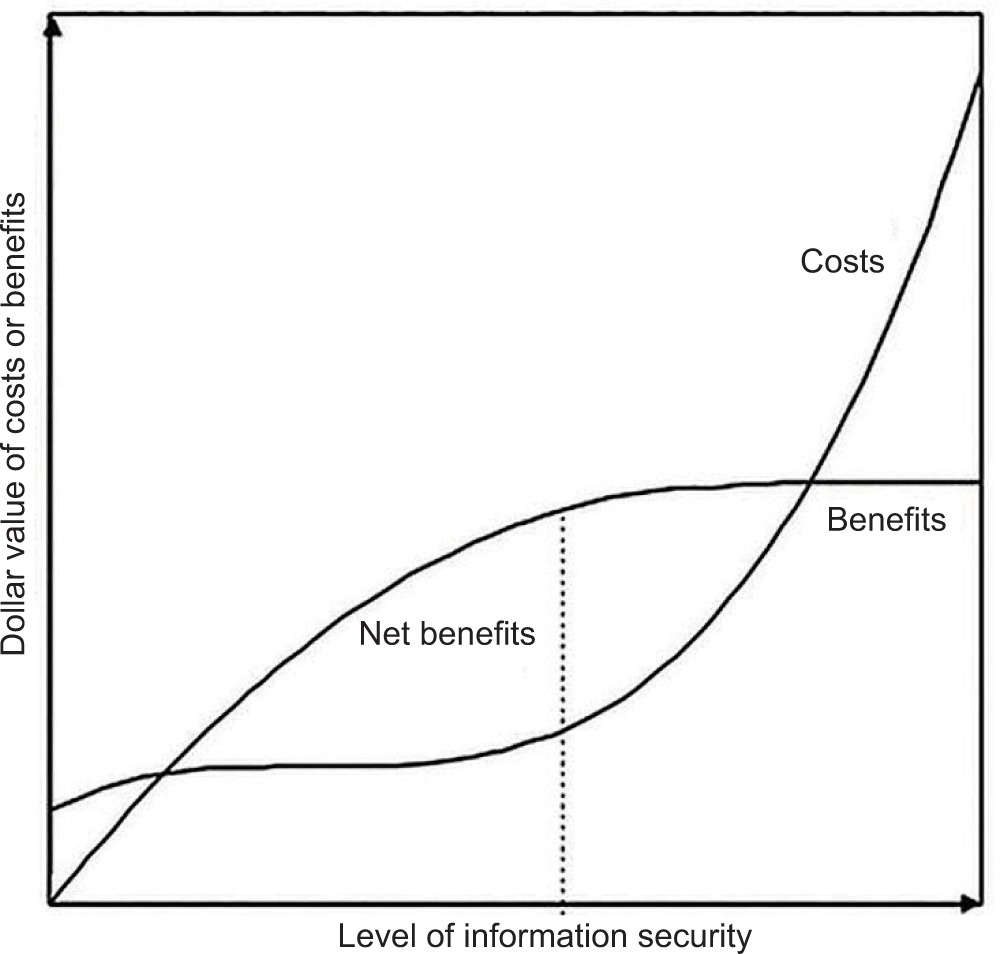
One must select security controls based on risk proportionality from a financial perspective, i.e., the costs remain lower than the benefits. The chosen control mix should help achieve the (pseudo-) optimum from the economic point of view. According to the microeconomic concepts of marginal revenue and marginal cost (Sklavos and Souras, 2006), a security budget is spent optimally when the marginal revenue and marginal cost are equal. This point represents the optimal security level (Gordon and Loeb, 2002, p. 9), denoted by S* in Figure 1.
However, due to inadequate knowledge or a negative attitude, management may view cybersecurity controls as unnecessarily bound up with legislation. The results of a survey conducted by Ernst & Young between August and October 2019 (Ernst & Young, 2020) supports the existence of this issue. Cybersecurity investment in the non-profit field is much lower, about half of the for-profit investments, according to (de Geest and Stranlund, 2019).
Many organisations consider IT security and other security aspects as a subset of IT management functionally and fiscally despite the apparent difference, goals, and incompatible functions. For example, organisations allocated an average of 8 per cent of their revenue for IT spending in 2019 (Statista, 2020). Nevertheless, finding the optimum where costs can be (pseudo-) minimised is not an easy task. However, the risk-based approach helps achieve this objective while meeting several constraints. For example, according to the balanced operational constraints, security controls that hinder or even prevent the achievement of business goals are unacceptable (Wheeler, 2011).
The following questions arise: What are the effects of the incidents? How do owners perceive the incidents? Furthermore, what are the options for an economic analysis of defence planning? Below, we introduce a framework to analyse our chosen case study comprising security-related events that affected Meta’s (previously Facebook’s) services, incidents which are not recognised or even disclosed publicly Romanosky (2016).
Methodology development
Cash-flow calculations
The NPV calculation is an essential tool for dynamic investment economics calculations and considers the time value of money. Therefore, the NPV is also excellent for analysing security investments (Brotby, 2009). To calculate the value of the expected expenses and returns before starting the investment, one must apply the following formula, in which CFt is the annual cash flow, while r is the interest rate:
Unlike the NPV, the Net Future Value (NFV) calculates the value of a sum of the cash flows at some point in the future, giving the represented value:
In the above equations, it is assumed that cash flows occurred at the end of each year or, at least, they are discounted to the end of a given year by the effective interest rate, eri, where i is the number of days remaining until the end of the given year.
Although NPV and NFV calculations are essential tools in investment calculation, they are sensitive to determining the proper cash flows and choosing appropriate interest rates unless they represent valid present or future values (Beccarini, 2007).
Determining the interest rates
When examining corporate and shareholder values, the basis for calculating interest is usually the cost of capital, where corporate (A), shareholder (E), and lending (D) capital costs differ. There are several options for calculating the shareholders’ cost of capital, from which the Capital Asset Pricing Model (CAPM) (Sharpe, 1964) is a widely applied formula:
In the above equation, rE represents the return on an individual stock, rf is the risk-free interest rate, and rm is the market interest rate. β measures the volatility of an individual stock compared to the systematic risk of the entire market, representing a particular stock’s returns against those of the whole market. For an unleveraged company, the corporate interest rate (rA) equals the shareholder interest rate (rE); however, if a company is leveraged, the weighted-average cost of capital (rwacc) must be taken into account. Furthermore, considering that particular case of rwacc when D = 0, rwacc, equals rA (rA = (rwacc|D=0)). Therefore, we consequently apply rwacc for the calculations.
Possibilities of ex-ante analysis
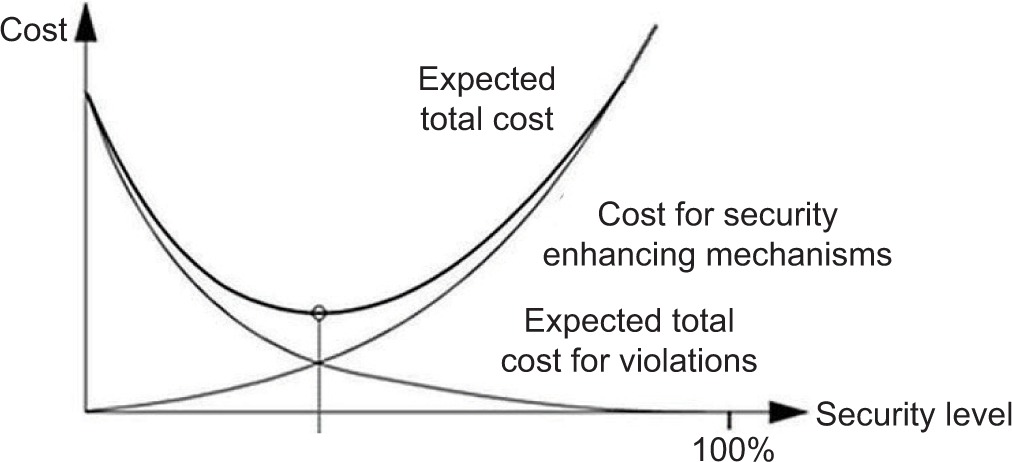
When planning security controls, there are uncertainties in valuing expenditures and revenues (benefits) that each organisation must tackle. Over time, incidents may happen intentionally, according to the risk-proprietary approach. In this case, the expected total cost of security comprises the cost of the security-enhancing or reservation mechanism and the expected total cost of violations (Olovsson, 1992; Ruan, 2017), as displayed in Figure 2. This is a cost-based approach finding the optimal security level denoted by S* in Figure 1.
The base of estimation methods is very often the annualised loss expectancy (ALE) which is the product of the single loss expectancy (SLE) multiplied by the annualised rate of occurrence (ARO):
ALE = SLE × ARO
ARO is the estimated frequency of the given risk’s occurrence within one year. SLE is the amount of the aggregated expected monetary loss of a security incident’s impact on an entity’s operations, data, and IT assets. The SLE thus summarises direct, indirect, legal, operational, and human-like damage values which depend on the affected asset’s value (AV) and exposure factor (EF), which is the percentage of the damage or loss compared to the AV:
SLE = AV × EF
Finally, as the ALE is a multiplication of the AV, EF, and the annualised rate of occurrence (ARO) representing a one-year interval loss value, assuming the loss expectancy is constant for an n-year-long time interval, one can calculate it like this:
Several models or metrics use the ALE to analyse risks choosing security controls in the planning phase, and evolving the S* optimal control mixes, such as the value at risk (VAR) and the net present value (NPV) methodologies. We should be aware that security incidents might have national or global impacts on the market, such as the Colonial Pipeline shutdown on gasoline prices (Tsvetanov and Slaria, 2021). Due to its special nature, we cannot count on that in the ALE calculation.
Regarding the given security control mix that affects the operation, i.e., the controls can prevent incidents or reduce their impact from its activation with a planned ALE, the aggregated cost of commissioning and maintenance is the solution cost (SC). Therefore, if one needs to calculate the cash flow comprising possible expenditures, then the NPV is calculated as follows:

Possibilities of ex-post analysis
For the periodic reviews of security controls, the substantial economic impacts of incidents serve as a crucial exact input about the nature of the non-compliance with confidentiality, integrity, or availability requirements determined by business needs. In contrast to the design of security controls, one must examine the effects of incidents afterwards, i.e., the NFV of the damage caused by an I incident.
However, an incident’s effects may last for years so the value concerned can be strictly determined by the summation of each year’s effect, It, applying the following formula, in which the subscript A represents that the examination’s subject is a company:
However, in performing an ex-post analysis, it is necessary to avoid confusion between the uncertain planning values and the past factual budgeting and incidents’ values. Accordingly, a distinction must be made between the date of design and repeated analysis when discounting values. Therefore, when comparing the planning value to the value modified after the incident, one must analyse the same time interval, and cash flows must, of course, be discounted to the same date.
In the ex-ante analyses, ALE and SCi are determined from the risk analysis that more or less represents the security budget for the given control mix, assuming an optimal cost-benefit balance. However, in the course of ex-post analysis, one has the exact yearly SCi values from its yearly planning security budget. Nevertheless, there may be a clear difference between the planning budget at the beginning of the year (BOTY) and the realised budget at the end of that year (EOTY). So, incident types and impacts are maybe different than the planned value. The question is the magnitude and direction of deviation in which the risk-based planning, the planned (BOTY), and the realised (EOTY) budgets may differ. In the following calculation, their NPVs are calculated and displayed; however, NFVs could also be checked in the same way:

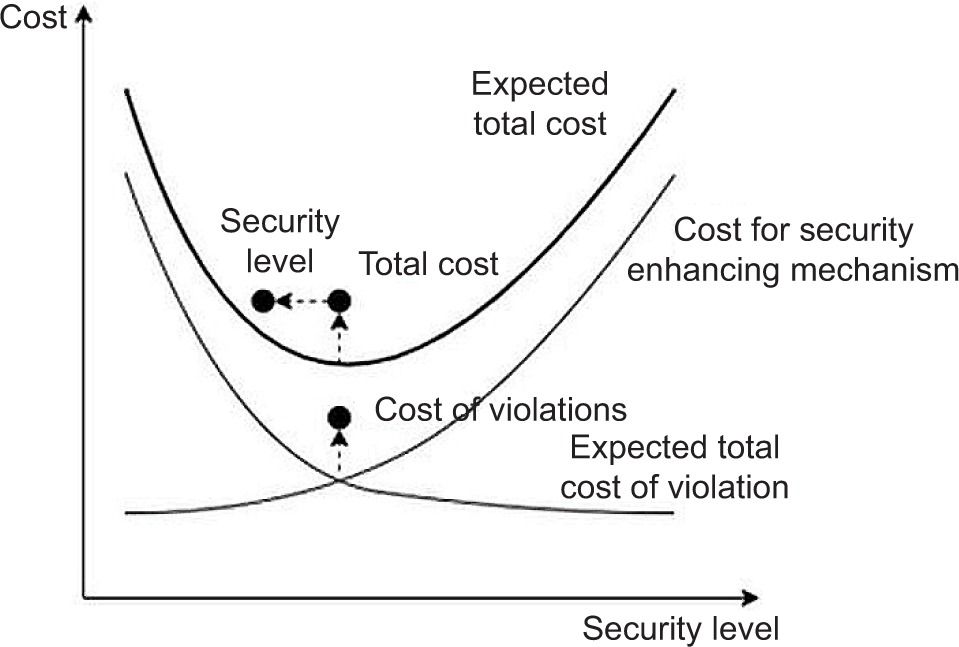
Furthermore, the realised interest rate can be applied for a more precise evaluation in an ex-post analysis. However, a negative deviation may result in an increased total cost for violations, having a chain-like effect that can ultimately reduce the security level of the entire system, as depicted in Figure 3.
In the interest of examining the mechanism’s on-the-fly effect on the budget, the following formula defines the Effect of incidents for an [1,n] examined interval based on NFV values of the security budget and incidents:
However, considering the shareholders’ behavioural biases and the differences in the perception of positive and negative events (Tversky and Kahneman, 1981), there may be a deviation between the shareholders’ perception and the magnitude of the incidents affecting the organisation. Matthew Rabin (1998) points out that shareholders overwhelmingly dislike losses. With regard to cybersecurity incidents, the following formula compares the change in stock prices (IP) and the change in shareholders’ value (IE) caused by the examined set of events connected with an incident that must be discounted by the shareholder interest rate (rE):
Analysis of the effect of security on stock prices
We use an event study (Armitage, 1995) to quantify an events’ economic impact with abnormal returns (ARs), applying the market model (MM) to calculate the expected return:
ARt = Rt – (α + βRM,t)
The MM builds on the actual returns of a reference market and the correlation of the given firm’s stock with the reference market, for which this model uses the ordinary least squares (OLS). The ARt signifies the difference between the actual stock return (Rt) on a particular day within the event window and the normal return, depicted by the relationship between the firm’s stock and its reference index (expressed by the α and β parameters). The model assumes that the residuals are normally distributed with a zero mean, have constant variance (homoscedasticity), are not serially correlated, and are not correlated with the explanatory variables. To test if heteroscedasticity negatively affects the estimation, we apply the Breusch-Pagan test (Breusch and Pagan, 1979).
To calculate the normal return, we use the S&P500 market’s return (RM,t). The Rt and RM,t are calculated by the natural log-normalised returns, i.e., in case of stock return,
We apply observation windows of [–150,–2] to analyse daily abnormal returns at a [–1,3] time interval as Figure 4 shows.

To measure the statistical significance of ARs, we apply the t-test (N = 149) for hypothesis testing, where the null hypothesis states that the mean of the ARs within the event window is zero (H0:μ = 0) and the alternative hypothesis states the opposite (H1:μ ≠ 0) for which test statistic is the standardised abnormal return given by:
where T0 is the earliest day of the estimation window and T1 is the latest day of the estimation window, and M denotes the number of non-missing (i.e., matched) returns.
Identification of the security-incident-related events
Short review of Meta’s incidents
In 2014, Cambridge Analytica collected Facebook user profiles in unethical and non-legal ways, affecting about 87 million users in the US (Business Insider, 2019). The publicity regarding the incident caused a drop in the company’s share price by approximately 7 per cent, on 19 March 2018 (CNBC, 2018).
According to revenue shortfalls, the share price fell 19 per cent on 26 July 2018 (MarketWatch, 2018). The closing price was $176.26, which means that compared to the previous day’s Wednesday market capitalisation, which was $630 billion, it fell to $510 billion by the end of Thursday’s trading day with a trading volume of 170 million. This change meant an impairment loss of approximately $120 billion.
On 28 September 2018, Meta revealed a data theft affecting about 2 million Facebook users’ date of birth, phone number, search history, and last login location. Even before the official announcement, on 27 September 2018, the share price fell by 3 per cent due to the publicity around the cyberattack (Business Insider, 2018).
By the end of the trading day on 18 March 2019, the shares were closing at 7.4 per cent lower than when the four-day long decrease began (International Business Times, 2019) due to the departure of product manager Chris Cox and vice president Chris Daniels of WhatsApp and the Needham downgrade. However, on 13 March, several hours of service outages affected all services due to an application error (The Verge, 2019).
On 24 March 2019, a security incident affecting the Instagram service was announced (Facebook, 2019c). On 18 April 2019, new information was revealed. When, on 12 June 2019, CEO Mark Zuckerberg’s sent a related email concerning problematic privacy practices, share prices fell 2.9 per cent (Markets Insider, 2019).
On 24 October 2018, the Information Commissioner’s Office (ICO) in the UK fined Meta £500,000 (approximately $643,000) for its role in the Cambridge Analytica scandal. However, Meta appealed on 21 November 2018, and on 14 June 2019, the General Court issued an interim decision ordering the ICO to disclose materials related to its decision-making process. On 2 September 2019, the ICO appealed against the interim decision, and finally, on 30 October 2019, the parties agreed, as a result of which Meta paid the penalty (Information Commissioner’s Office, 2019).
On 24 July 2019, the Federal Trade Commission (FTC) in the US imposed a $5 billion fine on the company (Federal Trade Commission, 2019). Furthermore, the Securities and Exchange Commission (SEC) charged an additional $100 million penalty (Facebook, 2019b) due to the investigation process.
Despite the fines and additional security incidents (e.g., in September 2019, Techcrunch (2019) reported data leaks due to several unencrypted databases with 419 million records), Meta’s 2019 Q3 results exceeded the expectations of analysts and investors (CNBC, 2019).
On 19 May 2020, the competent authority, the Competition Bureau Canada, imposed a CAD 9 million fine for improper data protection practices in Canada. The authority added a procedural fee of CAD 500,000 (approximately USD 13,221,150 in total) (Competition Bureau Canada, 2020).
Although several data protection authorities in the European Union have been active against the company on several issues, Meta was only fined €51,000 in Germany alone in 2019 for non-compliance with Article 37 of the General data protection regulation (GDPR), i.e., the failure to appoint a data protection officer (Hamburgischen Beauftragten für Datenschutz und Informationsfr., 2019).
Identification of events
Five distinguishable incidents affected Meta’s services (|I| = 5) – (1) Cambridge Analytica scandal, (2) Instagram vulnerability and possible data breach, (3) the leakage of 419 million data records, (4) data theft affecting 50 million users, and (5) downtime affecting all services. The fine of €51,000 imposed in Germany for non-compliance with Article 37 of the GDPR does not relate to the identified security incidents; therefore, we simply omit it.
Table 1 notes the identified events of the given incidents that modify the event date for which there are essential modifier factors discussed herewith. On 17 March 2018, Meta announced suspension of Cambridge Analytics access due to misuse of user data. The announcement was made on a Saturday. On 25 July 2018, the company announced a 19 per cent decrease based on a market report describing revenue shortfalls in the late afternoon. Unofficial sources revealed data theft affecting 50 million users on 27 Sep 2018; however, the official announcement was made during a call with reporters the following morning. On 13 March 2019, an application downtime for all services lasted for hours, which got publicity among shareholders the next day. However, on 18 March 2019, Facebook notified business and personal changes unrelated to the incidents but shortened the previous event’s observation period. Lastly, the FTC imposed a $5 billion penalty for Cambridge Analytica data leaks on 24 June 2019, which got publicity the following day.
Table 1.
Incident-related events.
In connection with the separate incidents, based on the modifier factors, we identified the first trading days determined by the incident-related events displayed in Table 2. Regarding further incidents, we use numbers in superscript to distinguish them consequently. The events of 12 June 2019 and 19 May 2020 occurred due to Meta’s previously conducted security behaviour; therefore, they cannot be clearly categorised as an incident. So, we divide their cash-flows among I1, I2, I3, and I4 incidents if there are any.
Table 2.
Date of the effective events.
Discussion
Data and methodology
Based on the review we previously provided, we distinguish five security incidents: (1) End users suffered paramount and impactful privacy and information security incident in 2016 from Cambridge Analytica, (2) Instagram vulnerability and possible data breach, (3) leakage of 419 million data records, (4) data theft affecting 50 million users, and (5) downtime affecting all services. Table 3 displays the results of the publicly known corporate costs of the incidents. However, in our opinion, these values serve as the estimated minimum for the extra corporate costs of the incidents as there are potential publicly unknown extra negative cash flows.
Table 3.
Publicly known extra corporate costs of the incidents.
The Cambridge Analytica scandal deeply affected Meta in the period following March 2018, resulting in the company’s revenue being reduced. For the 2018 Q2 period, revenue was $13.73 billion, which fell short of initial expectations (–$92.44 million). For the Q3 2018 period, the company had $13.23 billion in revenue, which also fell short of analysts’ expectations (–$115.24 million). These shortfalls are to be expected as an undesired impact of the incident. However, despite further incidents with high consequences, Meta was profitable in both years as it had annual revenues of $55,838 billion in 2018 and $70,697 billion in 2019, while its total operating expenses were $30,925 billion in 2018 and $46,711 billion in 2019, respectively (Facebook, 2020).
However, although the events displayed in Table 2 relating to the identified incidents started to occur in 2018, the root cause of the Cambridge Analytica scandal originated in 2016. Therefore, it is worth examining the overall company-related effects from 2016 to when the last event occurred in 2020. According to an announcement by the CEO of Meta (Roettgers, 2019), 2019’s security budget was worth $3.7 billion. However, to analyse the corporate effects, there is a further need to identify Meta’s yearly security budget. There is no additional exact information about budgeting, so we must assume other years.
Many organisations consider IT security and other security aspects as a subset of IT management functionally and fiscally despite the apparent difference, goals, and incompatible functions. Therefore, it is worth assuming the budget in the same way. According to Gartner (Hall et al., 2016), IT security spending ranged from approximately 1 per cent to 13 per cent of the IT budget in 2016. Meanwhile, in 2021, researchers measured IT spending of the software companies as 15 per cent of revenue on ICT (Flexera, 2021). With regard to the cybersecurity budget, the analysts estimated the cybersecurity budget from 6 to 14 per cent of their information technology budget according to the Deloitte and the Financial Services Information Sharing and Analysis Centre (FS-ISAC) report in 2019. On average, organisations allocated 10.1 per cent of the IT budget and 10.9 per cent for 2020 (Bernard et al., 2020). For the analysis, we assume higher budgeting percentiles. Assuming that the IT budget was 11.4 per cent of the revenue and the cybersecurity or IT security budget was 10.1 per cent of the IT budget, on average, we apply 0.011514 multipliers to the revenue for calculating the cybersecurity or IT security budget. Considering this multiplier is a rough estimate, we conduct a risk analysis later in the paper that examines budget changes for the given calculation.
Table 4 displays the NFV of the yearly estimated security budget of Meta and the identified incidents and other input data as revenues, expenses, shares, asset and shareholder value, and liabilities (Facebook, 2017, 2018, 2019a, 2020, 2021). The yearly cost of capital ex-post is based on the CAPM model using exact values for the given years. We applied the annual real returns on T Bond (Damodaran, 2021) as rf and the MSCI ACWI Index (USD) (MSCI, 2021) for calculating rM. We determined rf,nom from the US real interest rate (Federal Reserve Bank of St. Louis, 2021) and the US inflation rate (Coin News, 2021), and lastly, we calculated β using Meta stock prices (Financial Content, 2021) and the S&P500 index (Yahoo! Finance, 2021). The publicly known corporate costs of the incidents displayed in Table 3 are discounted to the end of the given year by the effective interest rate (eri). Lastly, according to the annual reports, the company did not work with long-term debt; however, liabilities exist yearly, so we apply rwacc to discount cash-flows, and we approximate rD with rf,nom assuming a perfect lending market (Ahn, 2016) without any spread, as Meta did not have any debt rating.
Table 4.
Corporate financial data.
Findings
Table 5 displays the value of corporate changes related to incidents discounted to the end of the given year with the effective rate. Based on the highlighted extra cash-flows and the estimated security budgets, the calculated Effect of incidents metric shows that the corporate effects of the incidents increased the overall costs by approximately 87.95 per cent of the estimated security budget.
Table 5.
Calculation of the incidents’ corporate net future values and the Effect of incidents.
However, assuming the security budget’s estimation was probably inaccurate, we created what-if scenarios to analyse lower and higher yearly security budgets. Figure 4 displays the impact of incidents depending on the NFV of the annual budgets and the NFV of the incidents that altered the security budgets. Unsurprisingly, the higher the yearly budget, the lower the impact of incidents as the incidents’ values remain.
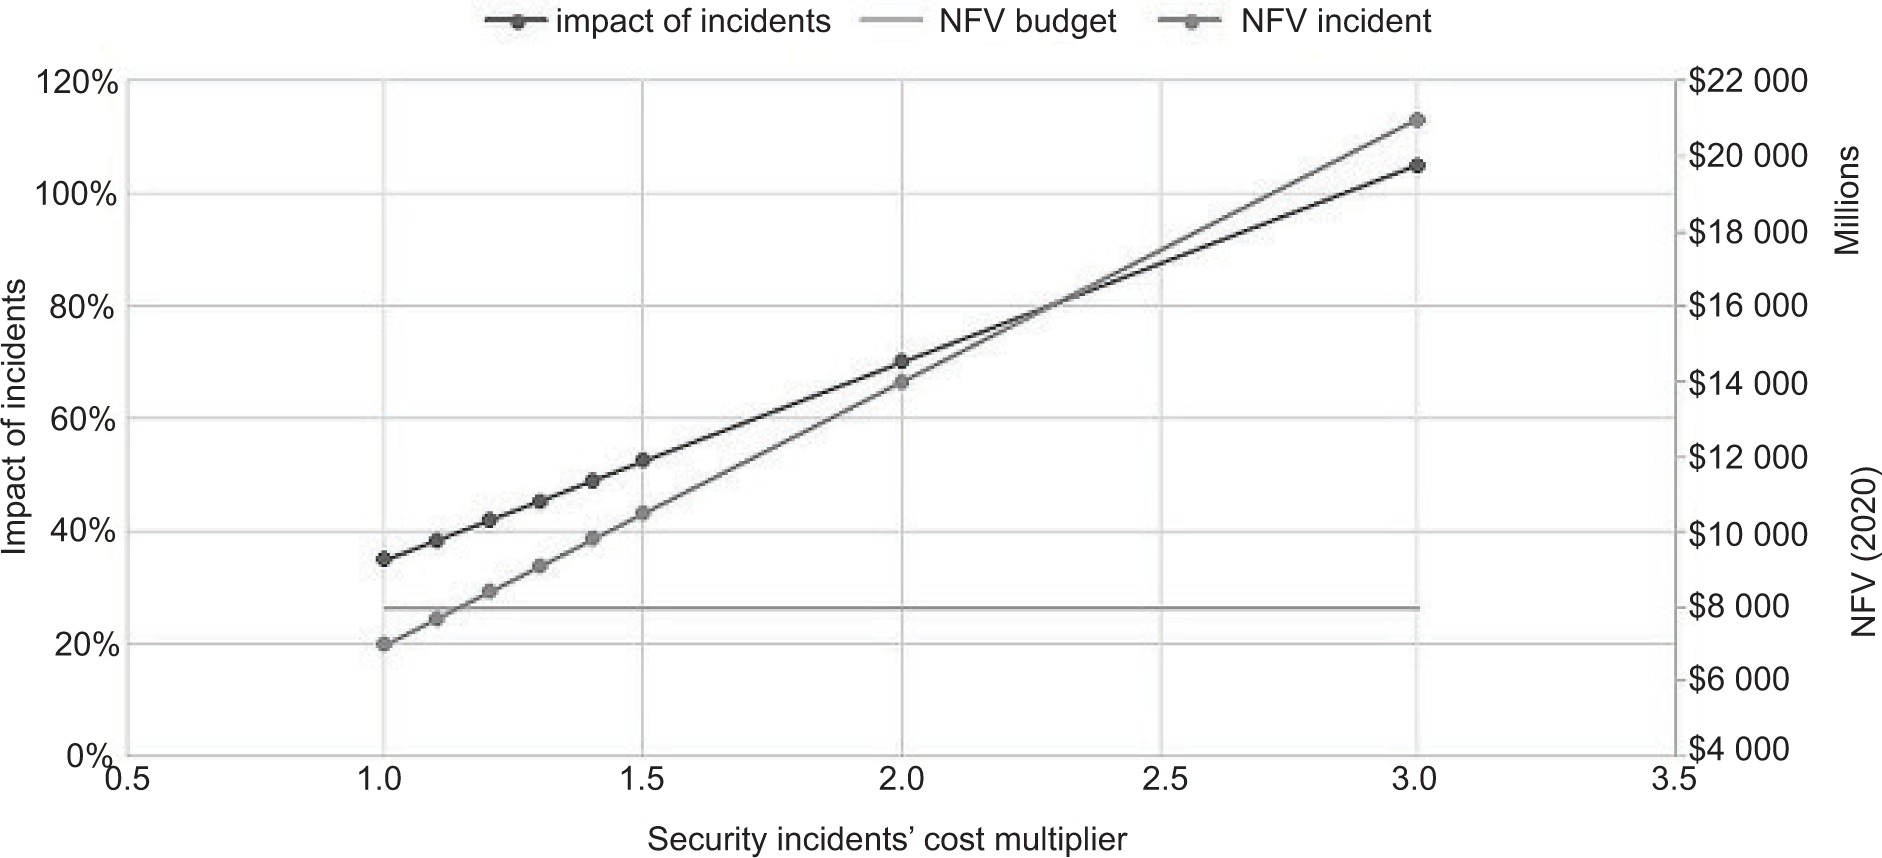
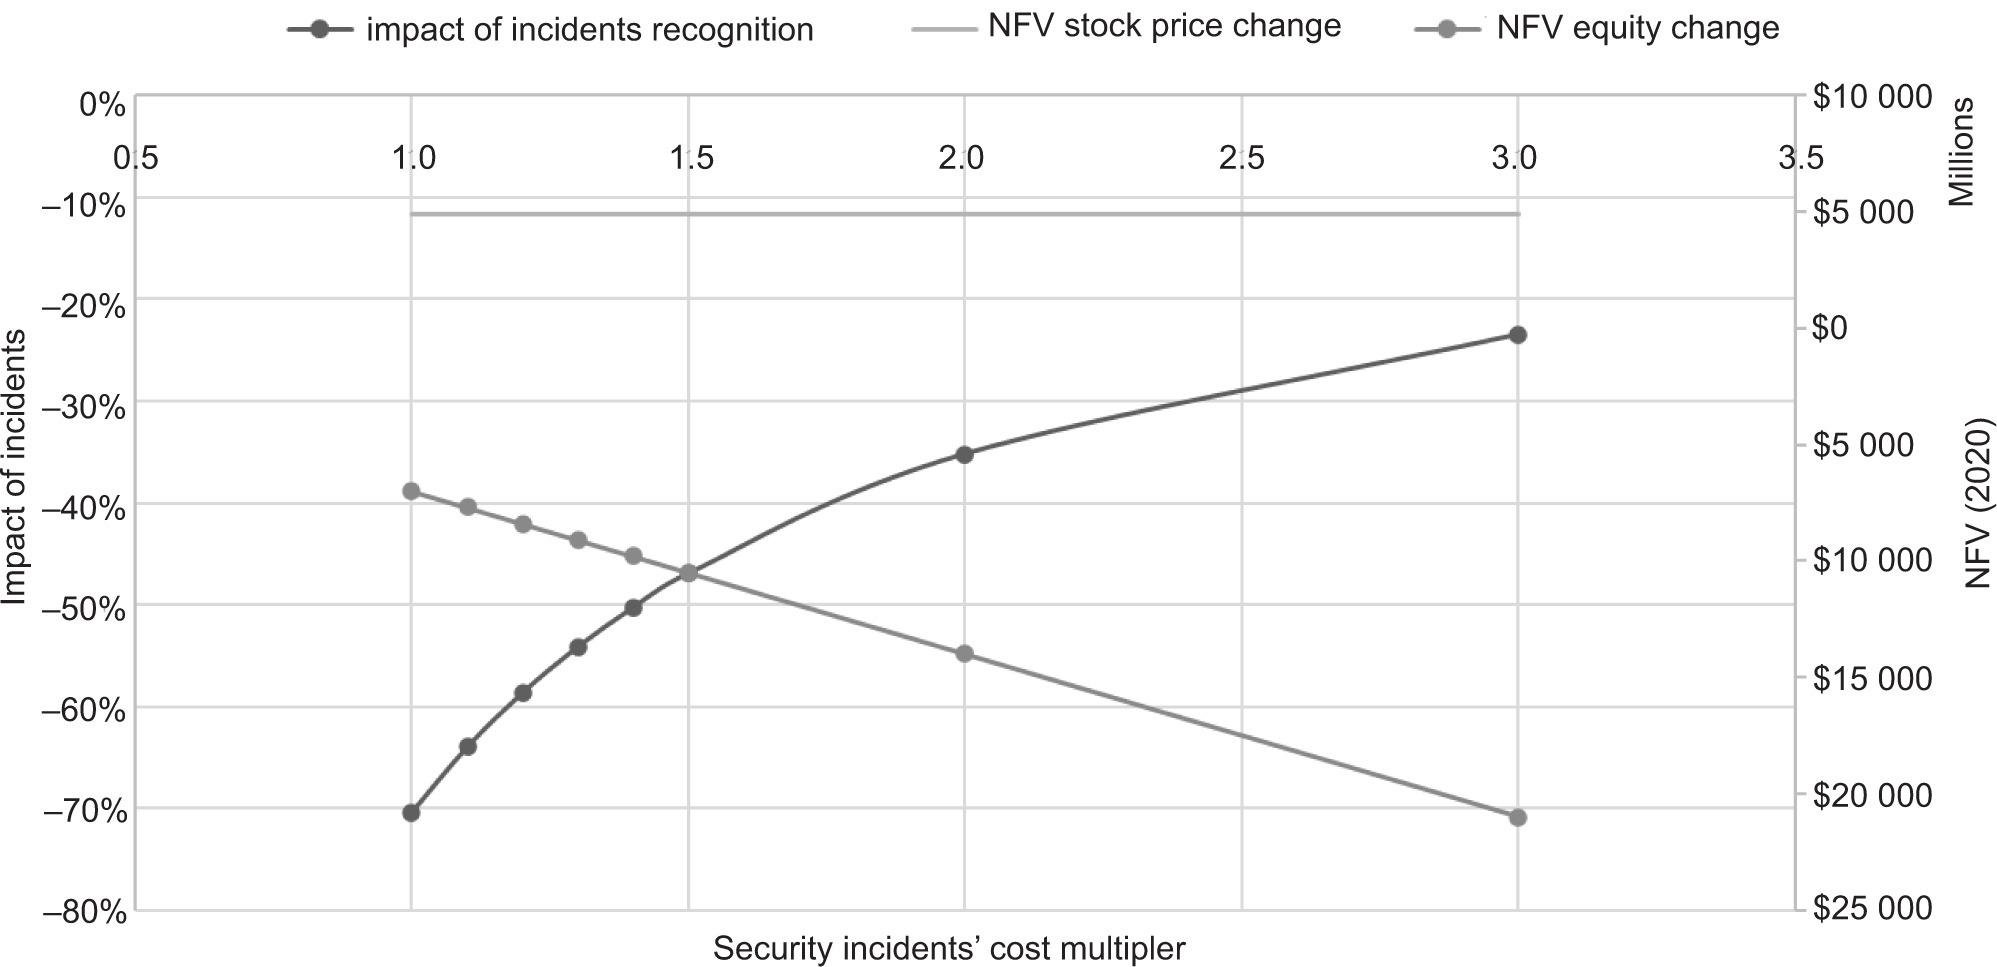
On the other hand, we created what-if scenarios regarding the valuation of the incidents’ corporate effects representing lower estimates. Figure 6 displays the impact of incidents depending on the NFV of the yearly budgets and the NFV of the incidents that altered the costs. Inevitably, the higher the corporate expenses of incidents (via the cost multiplier), the higher the impact of incidents. The security budget is constant for this time.

Analysing the Incidence of incident recognition
We used significant ARs to calculate the Incidence of incident recognition on the stock and asset changes on discounted values up to 2020, the corporate effects (IA) of which we apply in Table 3, and the cost of capital and shares in Table 4. However, in this case, the corporate effects must be discounted with IE to get the equity-related changes.
According to Table 6, there are six events for which significant ARs can be identified. Taking the identified ARs, we calculate the overall values they represent for a given year and their NFVs discounted to 2020. Comparing the calculated NFV of stock changes to the equity-related changes shows that the stock changes were -70.40 per cent of the effects on equity, meaning that the short term abnormal-return-related stock price changes and the equity-related changes had opposite effects. Because the estimation of the security budget creates uncertainty for the Incidence of incident recognition, we analyse what-if scenarios on the security budget. As Figure 7 depicts, the higher the costs of security incidents, the lower the Incidence of incident recognition.
Table 6.
Abnormal returns.
Conclusions
Although the development of technology has improved efficiency for individuals, organisations, and hence society, it appears as a risk factor. The complex chain of entities’ relationships also creates a complex ecosystem in terms of cybersecurity. Therefore, to reduce risks, each entity’s responsibility is to establish and maintain cybersecurity controls for which several control mixes can be selected for creating and maintaining the appropriate preventive and reactive capabilities, i.e., there are several alternatives. Each alternative may differ not only in nature but also in the quality of security controls, but it is necessary to select and optimise security capabilities per risk proportionality and risk appetite for cyber safety, and the absence of such has economic implications. The consequence of taking risks is that it consciously entails incidents. However, some incidents can increase planned costs and decrease security level. The cash flows caused by unplanned incidents with such an impact are generated in addition to the “normal” (planned) operation. However, once the incidents’ financial impacts have been identified, it is possible to analyse ex-post and compare the past and planned values, for which we started the methodology development from loss-expectancy-based ex-ante analysis that should serve the basis for the annual security budget using CAPM-based interest rates.
The consequences of the incidents, such as the possibility of imposing a penalty, imposition, loss of revenue, can be huge, significantly increasing the costs related to IT security compared to the assumed budget. The financial consequences for a company may be that the incidents increase the expenditure compared to the pre-defined budget. To analyse these effects, we introduced the Effect of incidents and the Incidence of incident recognition metrics for measuring business effects and making a deduction related to the behaviour of shareholders. Because shareholders can perceive incidents as a kind of shock effect, we assumed in advance that the share price might differ from the asset value in connection with the examined events.
We took publicly disclosed cybersecurity incidents that affected Meta’s (previously Facebook’s) services during a time interval from 2016 to 2020 to find answers to the pre-set questions, applying the introduced metrics. We distinguished five security incidents: (1) End users suffering a significant attack on their privacy because of the Cambridge Analytica information security incident in 2016; (2) the Instagram vulnerability and possible data breach; (3) the leakage of 419 million data records; (4) the data theft affecting 50 million users, and (5) downtime affecting all services.
Based on the calculated Effect of incidents metric, there were extra cash flows compared to the estimated security budgets that considerably increased the security-related expenditures. In light of this, companies should take extra care to choose the right security control mix and budgeting. However, with regard to the uncertainty around estimating the security budget, we created what-if scenarios in order to analyse lower and higher yearly security budgets, which clearly show that the higher the annual budget, the lower the impact of incidents because the incidents’ values remain. On the other hand, with regard to the lower valuation of the incidents’ corporate effects, we created what-if scenarios on the incidents’ corporate effects which showed that the higher the corporate costs of incidents (in this case via the cost multiplier), the higher the impact of incidents.
The event-study-based analysis of stock prices showed that there were six events with abnormal returns that significantly influenced daily prices. Based on the abnormal returns, comparing the calculated NFVs of stock changes to the equity-related changes showed a deviation between the shareholders’ perception and the actual magnitude of the incidents affecting the organisation. The what-if scenarios on the security budget indicated that the higher the security budget, the lower the Incidence of incident recognition.
The Incidence of incident recognition suggests that investors may have significantly overreacted to the related news. Accordingly, the security incidents apparently affected the company’s beta and stock volatility. However, to find out whether these effects are unique for the examined incidents or Meta, it will be necessary to carry out further research. Currently, it is only an assumption that a cyberattack is a considerable non-systematic, diversifiable risk factor for shareholders.