1. Introduction
The recent literature on North Atlantic Treaty Organisation (NATO) cohesion is dominated by contributions which try to tackle the role of the alliance following the end of the Cold War. There is a wide selection of ideas, suggestions, and propositions to consider in this direction (e.g. Hartley 2020, p. 507; Sandler and Hartley, 1999, p. 249). The question that arises, though, is the extent to which NATO can function when facing such challenges as the ones mentioned in such contributions, before settling various open issues in its own back yard which lead to friction1 between its members and threaten its cohesion.
There is, however, an additional case of in-NATO friction, far older than any of the above, the one between Greece and Turkey. Most sources consider the beginning of this conflict to be in 1974 with the Cyprus crisis, although its roots date back even earlier to the start of the 1950s. This issue has developed into a popular topic in the literature as it has grown to represent a typical arms race case (Andreou and Zombanakis, 2006, pp. 1-18).
Given this rather unorthodox background in which two NATO allies have been entangled in an arms race, one cannot help wondering about its impact on the cohesion of NATO. This paper hopes to add to the academic literature by proposing several modifications to a typical defence spending function aimed at reflecting cases in which a NATO member faces a so-called “internal threat”. This is a concept involving the hostile attitude of a member of the alliance to another and is considered as being inversely proportional to the strength of its intra-cohesion. (Weitsman, 2013, p.1 ), It also attempts to assess the cost inflicted upon such a member mainly in terms of extra equipment purchases. To do this, we shall focus on modifying the demand for Greece’s defence spending as this is affected by its long-term rivalry with Turkey, both being NATO members. This modification will distinguish between two categories of variables. First, the standard long-term variables like the threat facing the country or alliance in question and the spill over benefits accrued because of the alliance membership variables (Smith, 1980, pp. 811-820 and 1989, pp. 345-359). Second, the short – run ones outlining the friction incidents between the two allies in the context of the arms race between them. We will finally investigate the matter of cohesion between the allies in this perspective. Our analysis will refrain from dealing with geopolitical matters and it will avoid choosing sides in the sense of allocating the responsibility for this friction within NATO to either of the two parties involved. Therefore, the choice of Greece’s typical demand for defence spending will be justified based on the data available, mainly as regards the “threat” variable and its variations. Thus, following a brief literature review, Section 3 describes the theoretical background with an emphasis on the main variables and the modifications carried out to fit the Greek–Turkish case. Section 4 considers the model used and describes the data employed in light of the modifications to the standard theoretical background. The results derived and the ensuing policy implications are found in Section 5, followed by a forecasting exercise in Section 6 to assess the outlook for the defence expenditure of Greece as outlined in response to Turkish pressure. Finally, the conclusions drawn are presented in Section 7.
2. A Brief Literature Review
Most of the papers on the issue of the defence expenditure function and its determinants use conventional models for a time series or panel analysis employing three main variable categories: economics and production, technology, and geopolitical and security. Several early, well-established contributions include Hewitt (1992, pp. 105-152), Jones-Lee, (1990, pp. 13-16), and Smith (1980, pp. 811-820 and 1989, pp. 345-359). Some focus on developing countries e.g. Biswas and Ram (1986, pp. 361-372) and Deger and Smith (1983, pp. 335-353), while a number of papers concentrate on individual country cases (Murdoch and Sandler, 1985, pp. 142-153) or alliances (Knorr, 1985, pp. 517-536; Murdoch and Sandler, 1982, pp. 237-263). Regarding recent contributions, there seems to be a trend which emphasises human resources and raises welfare considerations, some of them with reference to the China such as Fumitaka et al. (2016, pp. 137-160) and Ying et al. (2017a, pp. 731-749; 2017b, pp. 686-702). In fact, human resources variables like population growth and per capita income are considered as significant determinants (Dunne and Perlo-Freeman, 2003, pp. 23-26). Finally, on the techniques of analysis issue, there have been some cases leading to inconclusive results on this subject using conventional models (Brauer, 2002, pp. 85-107; Hartley and Sandler, 1995, pp. 19-51; Taylor, 1995, pp. 13-47). To deal with this problem, the focus has shifted towards artificial intelligence methods and, specifically, Artificial Neural Networks (ANN) to determine the defence expenditure of Greece (Andreou and Zombanakis, 2006, pp. 1-18).
The case of Greek–Turkish friction and the arms race between the two sides occupies a leading position in the literature (e.g., Andreou and Zombanakis, 2011, pp. 459-469; Sezgin, 2000, pp. 427-435). In fact, examining the case of Greece as regards its defence spending is done either in the context of a broader economic and geopolitical environment (Dunne et al., 2003, pp. 447-460; Nikolaidou, 2008, pp. 273-292), or focusing on the country itself (Katsaitis et al., 2019, pp. 177-201; Kollias and Paleologou, 2007, pp. 133-149). The latter offers a dual methodology in terms of techniques of analysis, both conventional econometrics and artificial neural networks. It is interesting to see that the demand for military expenditure has been occasionally represented both in the context of arms-race models (Intriligator and Brito, 2000, pp. 45-54) and in that of alliance models (Hansen et al., 1990, pp. 37-56). However, there is no empirical contribution thus far that has tackled the particularity of the Greek case, namely a country that must consider an arms race against an ally. This brings us to a considerable issue raised by Weitsman (2013, p. 1) that refers to the possibility of an internal threat to an alliance. As pointed out in the introduction, this is a concept considered as being inversely proportional to its intra-cohesion strength, a question posed by several other contributors such as Tardy (2018, pp. 1-18), who addresses it as “the threat from within”.
This paper then aims to tackle modifications that a typical demand for defence spending must undertake when there is a threat from within, namely when the identity of an ally coincides with that of an adversary. In such cases, the cohesion of the alliance becomes a leading issue with Lute and Burns (2019, p. 4) who trace its roots to the extent to which all members adhere to the alliance’s values. By contrast, Binnendijk and Priebe (2019, p. 1) are more straightforward when posing the question of cohesion to all NATO members in the event of a Russian attack on a member state. Finally, Zandee (2019, p. 2) attempts a medium-term forecasting exercise in light of all recent threats to the cohesion of NATO.
3. Materials and Methods
3.1. The Issue of Cohesion
Quoting Tardy (2018, pp. 1-18), “one of NATO’s characteristics is that its raison d'être stems from the need to address external threats – the Soviet Union during the Cold War, Russia or less well-defined challenges such as terrorism or cyber threats today. NATO’s cohesion and relevance must be measured against its ability to tackle those external issues”. And yet, despite the clear external threat, there have been signs of lack of cohesion ever since the mid-1960s when the French president Charles de Gaulle downgraded France's membership of NATO. As a consequence, France withdrew from the U.S.- led military command to pursue an independent defence system. Since then, there have been several cases of threats to NATO cohesion like the withdrawal of Greece from NATO military command for about six years in 1974 following the Cyprus crisis. During the recent past, when threats became less well-defined, the blows to cohesion became easier to give and for less important reasons. Thus, since the 2016 attempted coup d'état in Turkey and the country’s warming relations with Russia, there have even been calls for Turkey to leave NATO!2
The difficulty in agreeing on a common external threat (Wallander, 2018, pp. 70-81) and the various incidents of friction among the allies triggered considerable research on the topic. This research seems to agree that one of the main reasons for the friction and the ensuing lack of cohesion in the alliance is the failure of some member states to adhere to the fundamental NATO norms and core democratic values. (Bazin and Kunertova, 2018; pp. 1-12; Binnendijk and Priebe, 2019, p. 1; Lute and Burns, 2019, p. 2; Tardy, 2018, pp. 1-18). Thus, in an environment of lack of consensus on the identity of the common enemy, “threat assessment differentials in terms of dissimilar prioritisation based on the perceived level of threat negatively affect alliance cohesion to a significant extent” (Bazin and Kunertova, 2018, pp. 1-12). When looking at this issue, however, one must distinguish between the exogenous, or external threats and the endogenous internal challenges or frictions, like the burden-sharing debate raised mainly by the US (Tardy, 2019, pp. 1-18). Such issues can lead to anything, ranging from diplomatic and political discussions to incidents of aggressive behaviour depending on the extent to which the parties involved adhere to the fundamental democratic values. A typical example of the latter extreme case is what Weitsman (2004, p. 1) calls “the Greece–Turkey anecdote” and it will be the internal threat that this paper will consider.
3.2. The Background
Focusing on this Greece–Turkey anecdote, which according to the author “demonstrates that the dichotomy between “enemy” and “ally” may be misleading” therefore requires a brief explanatory background. Both countries have been NATO members since 1952. Since then, there have been numerous occasions on which friction between them on a wide selection of issues (territorial waters, national airspace, flight information region [FIR] for the control of flight activity, and the continental shelf), escalated to the brink of war in 1974, 1987 and 1996.3 Given this background, one could not really wonder why both countries, despite being NATO members, have been entangled in an arms race (Andreou and Zombanakis, 2006, pp. 1-18) while occasional efforts to talk these issues over have failed. For the purposes of this paper, we shall be compelled to focus only on the national airspace issue since this is the one related to the error-correction mechanism we shall be using for the analysis, and which will be explained later on in the paper.4 The reasoning behind this specific choice is based on the fact that the number of daily engagement incidents between aircraft of the two sides constitutes the most aggressive form of challenge given the data series available and is thus a selection much closer to the concept of threat compared to incidents of simple ICAO or FIR violations. The specific variable also assumes a clearly short-term character, as explained earlier on in this paper, and cannot be used in a long-run context, in which one runs the risk of deriving coefficients that may be difficult to interpret.
3.3. Analysing Threat
Given our discussion in Sections 3.1 and 3.2, the variable representing threat in the Greek defence expenditure function is considered to refer to the internal dimension of the concept, as it has led to an arms race between Greece and Turkey, i.e., an internal threat (Hartley, 2020, p. 14). This being the case of a long-run equilibrium, as already mentioned, none of the empirical sources referred to in the review above could ever tackle a case in which the identities of an ally and an adversary can coincide in the case of an alliance member. In fact, as pointed out by Sandler and Hartley (1995, pp. 19-51), the alliance model is a static (equilibrium) analysis. Even if one agrees that the behaviour of Turkey in the NATO alliance follows the “Joint Product Model” as opposed to the “Pure Public Good Model,” we still face a static, suboptimal Nash equilibrium environment.5 This means that our specific alliance model needs to be modified to acquire a dynamic dimension. We need therefore to adjust the demand for the defence expenditure function of Greece, as this is derived within the guidelines of the standard theory (Smith, 1980, pp. 811-820, and 1989, pp. 345-359). To do so, we will focus on the dynamics of the variables representing the threat.
Representing the concept of threat as used in a defence spending function requires caution. For example, the aggregate defence expenditure of a potential adversary, including funds channelled to equipment, personnel and infrastructure may be a reasonable approximation for a possible threat in the future. However, it does not entail the concept of an immediate and direct form of claim against the targeted nation’s sovereignty, or even an attack against it. To put it differently; threat might be regarded as a damoclean sword for the country in focus but is by no means an action exercising threat. The typical defence spending equation, by design, focuses on potential threat and cannot deal with situations where the adversary utilises its resources to challenge the sovereignty rights of the other country. Daily violations of Greek airspace by the Turkish Airforce is a case in point. In this paper, we show how the typical defence spending model can be modified to accommodate such phenomena.
During the last twenty-five years or so, demand for defence models have been based on the so-called vector error correction methodology (e.g. Kapopoulos and Lazaretou, 1993, pp. 73-86). The reason for the popularity of this technique is quite simple. Most of the variables in a demand for defence equation are non-stationary. If a stable relationship among these variables exists (in the jargon of econometrics if they are cointegrated), an adjustment/error- correction mechanism must exist to force them to return to their long-run equilibrium, in cases in which they deviate from it. Typically, such an adjustment process is treated as a black box. This paper aims to reveal part of the developments concealed in such a black box, as it modifies the typical error correction model by introducing a mechanism that accelerates the process that leads back to the long-run equilibrium. This mechanism is introduced via an estimation of the defence expenditure function of Greece but using the adjustment-disturbance variable as a fixed regressor. This variable has been chosen to represent the number of engagements taking place on a daily basis between Greek and Turkish aircraft on the grounds of the geopolitical dispute explained earlier in Section 3.2. In fact, such engagements are taken to approximate a form of disturbance away from the alliance long-run equilibrium between the two countries, given that such forms of friction are not expected to occur in the context of a typical alliance environment. We therefore consider the reaction of the HAF (Hellenic Air Force) to prevent the violation of Greek airspace by Türk Hava Kuvvetleri (THK) as a response of the Greek side to such sustained disturbances suffered aimed at restoring equilibrium. Such a response, however, requires the procurement of additional defence equipment to be implemented, and aims to accelerate and eventually restore the long-run equilibrium, as this is described by a typical defence spending function. One can safely argue, therefore, that the time and cost required for accelerating the procurement process of additional defence equipment aimed at facing such erratic, incidents and restoring the alliance long-run equilibrium, approximates the degree of the alliance’s sub optimality.6 It also indicates the loss of efficiency suffered by Greece as a NATO member while frictions against Turkey, an alliance partner, continue.
3.4.. Analysing Spillover Alliance Benefits
The SPILL variable is introduced in the analysis to represent the benefits enjoyed by an alliance member because of participating in it (Sandler and Hartley, 1995, pp. 19-51). The most important benefit stems from Article 5 of the Washington Treaty, which provides for collective defence, meaning that an attack against one ally is considered as an attack against all allies. The particularity in the Greek case arises because the threat is launched by a NATO ally, namely Turkey, a case on which there is no provision in Article 5. It seems, therefore, that the two alliance members must settle their differences that threaten cohesion without any official involvement by NATO authorities. It looks as if this is an almost impossible task given that it involves a case in which the two sides do not seem to share common core values (Bazin and Kounertova, 2018, pp. 1-12).7
It appears, therefore, that the Washington Treaty does not provide for cases of an “internal threat”8 and, consequently, one cannot consider the possibility of alliance benefits of the type stated in Article 5.
4. Model Outline and Data Description
4.1. The Model
In terms of a modification to the standard theory, we use defence spending on equipment in the case of Greece as the dependent variable of our demand for defence expenditure function. By contrast, in the case of Turkey, we focus on total defence spending. The choice regarding the Greek case is founded on the grounds that the negative population rates of growth for Greece have led the country to put an emphasis on technology rather than personnel to face the demands of its defence doctrine. Thus, in terms of an indifference curve analysis between manpower (human resources) and technology (property resources), facing the problem of scarcity in the case of the former raises personnel costs and leads to an emphasis on technology. The aim of this choice is to maintain the initial defence output at the original indifference curve (Hartley, 2013, p. 76).
The corresponding picture in Turkey is quite different. Its population of more than 80 million grows at substantial rates every year. In addition, the country’s defence industrial base (DIB) is thriving and supports more than half of the country’s defence equipment requirements and causes considerable spin-offs and economies of scale. We argue, therefore, that the focus for Greece must be the overall nexus of both human and property resources of Turkey as these interact to represent the threat introduced in the Greek defence spending function.9
A further point worth noting is that we shall use defence spending as shares of gross domestic product (GDP) rather than levels. This option aims to avoid conversion problems between different currencies (Euros or Turkish liras) and conversion between current and constant figures in the absence of reliable price deflators. It also intends to consider the vast difference of the GDP levels between Greece and Turkey (Sezgin and Yildirim, 2002, pp. 121-128).
Since the aim of the paper is to modify the standard demand for defence expenditure function (Smith, 1980, pp. 811-820 and, 1989, pp. 345-359) to include the concept of the internal threat as applied in the case of Greece, we shall modify this standard theoretical background. We shall do this via the maximisation of a social welfare function under a typical budget constraint. The social welfare function will include a security function tailored to fit the Greek case as follows10:
S = GREQ – GREQT
where GREQ stands for the GDP share of Greek defence spending on equipment and GREQT the corresponding targeted national defence spending which is a function of
GREQT = b0 + b1*TURDEF
with TURDEF representing the GDP share of Turkish total defence spending.
Therefore, following the welfare maximisation procedure involving a security function and a budget constraint as indicated by Smith (1980, pp. 811-820), the Greek demand for the defence expenditure equation is shown to be a function of income, prices and the threat faced as follows:
GREQ = f (Y, p, TURDEF, SPILL)
where: Y is the Greek GDP, p is the price deflator for defence equipment procured and SPILL enters the specification as a country-specific variable representing NATO’s total defence spending as a GDP share and is added to the account for the environment.
This basic formulation needs to undergo a certain amount of fine tuning to suit the particularities of the Greek case. First, we drop prices due to the absence of a uniform price deflator (Nikolaidou, 2008, pp. 273-292), while previous research on Greek defence expenditure has shown that the GDP is insignificant when determining demand (Katsaitis et al., 2019, pp. 177-201).11 Thus, our basic defence equipment procurement equation will be:
GREQ = f (TURDEF, SPILL) (1)
Intending to stress the importance of distinguishing between property and human resources, we break down the TURDEF into its components as follows: The first is introduced via the trend of the increasing population rate of Turkey D(LTRPOP), whereas the property resources are represented by the GDP share of Turkish equipment purchases (TREQ).
GREQ = f [ TREQ, D(LTRPOP), SPILL] (1’)
According to theory, equations (1) or, alternatively (1’) represent the long run equilibrium. Estimating these equations, however, requires some caution. If the variables involved are non-stationary/random walks.12 As Granger and Newbold (1974, pp. 111-120) have shown, regressions with (I1) variables might be spurious, i.e. the statistical evidence might provide support for a non-existing relationship. It follows, therefore, that equations (1) and (1’) will only be valid provided that their variables are cointegrated. The idea is that the variables cannot drift too far apart since forces will act to restore the long run equilibrium.
Writing equations (1) and (1’) in estimation form after the fine tuning mentioned above and presenting the variables in log form yields:
LGREQt = b0+ b1*LTURDEFt + b2*LSPILLt + ut, (1a)
LGREQt = b0+ b1*LTREQ + b2*D(LTRPOP) + b3*LSPILLt + ut, (1’a)
where ut, the error term represents deviations from the long run equilibrium. For reasons that will become obvious below, the two equations can be written as
ut = LGREQt - b0- b1*LTURDEFt - b2*LSPILLt, (2)
ut = LGREQt - b0 - b1*LTREQ - b2*D(LTRPOP) - b3*LSPILLt. (2’)
Following standard practices, our first step is to examine the stationarity properties of the variables. Inspection of the graphs of the variables, see Figure 1, suggests that most of them cannot be stationary. Formal testing is, of course, required. We use the ADF test, by far the most popular, to test the stationarity properties of the variables.13 Table 1 shows that all our variables are I(1) except for D(LTRPOP) which is I(0). Typical cointegration tests of Engle and Granger (1987, pp. 251-276), Johansen (1991, pp. 1551-1580), or Phillips and Ouliaris (1990, pp. 165-193) require all variables in the model to be I(1). Clearly, these tests cannot be applied in our case. The solution to our problem is to resort to the bounds test and the related ARDL method of estimation (Pesaran et al., 2001, pp. 289-326), applied for the period between 1974 and 2018.14

Table 1
Typical ADF Tests for the Variables Used
| Levels | Differences | |
|---|---|---|
| LGREQ | 0.63 | 0.00 |
| LTURDEF | 0.71 | 0.00 |
| LSPILL | 0.60 | 0.00 |
| LTREQ | 0.08 | 0.00 |
| D(LTRPOP) | 0.0 | 0.00 |
| LDOGS | 0.08 | 0.00 |
It turns out that the hypothesis that the two models are cointegrated cannot be rejected with any reasonable level of confidence; therefore, we can proceed with an estimation.
As we have discussed, cointegration implies the existence of an error correction mechanism. The empirical model (2_and (2’) can be written as:
The equations above are the typical representations of an error correction model. Changes of the dependent variable depend on the history of all variables15 of the long run model, deviations from equilibrium and, possibly on variable(s) z which might impact upon the adjustment process, in our case fighters’ engagements. Note the critical role of the term α which must be negative if an equilibrium is to exist. So, if we have a positive deviation, a negative force is exercised upon the dependent variable to restore equilibrium, and if we have a negative deviation, a positive force is exercised.16 e is the residual.
4.2. Input Data
The dataset used in this study contains the variables in Table 2 below and is composed of 52 observations covering a period between 1967 and 2018.
Table 2
The Dataset
5. Results and Policy Implications
5.1. Results
The estimates17 of our long-run defence spending function for Greece (1a), after adjusting it for the drop in prices and the GDP, are shown in Table 3 (equation 1a) and Table 4 (equation 1’a) with the variables expressed in log form:
Table 3
Greece: The Long - Run Defence Expenditure Function
(Dep. Variable: LGREQ)
Table 4
Greece: The Modified Long - Run Defence Expenditure Function
Dep. Variable: LGREQ)
The corresponding estimates of the short run/adjustment parameters are shown in Tables A1 and A2, respectively, in Appendix A.
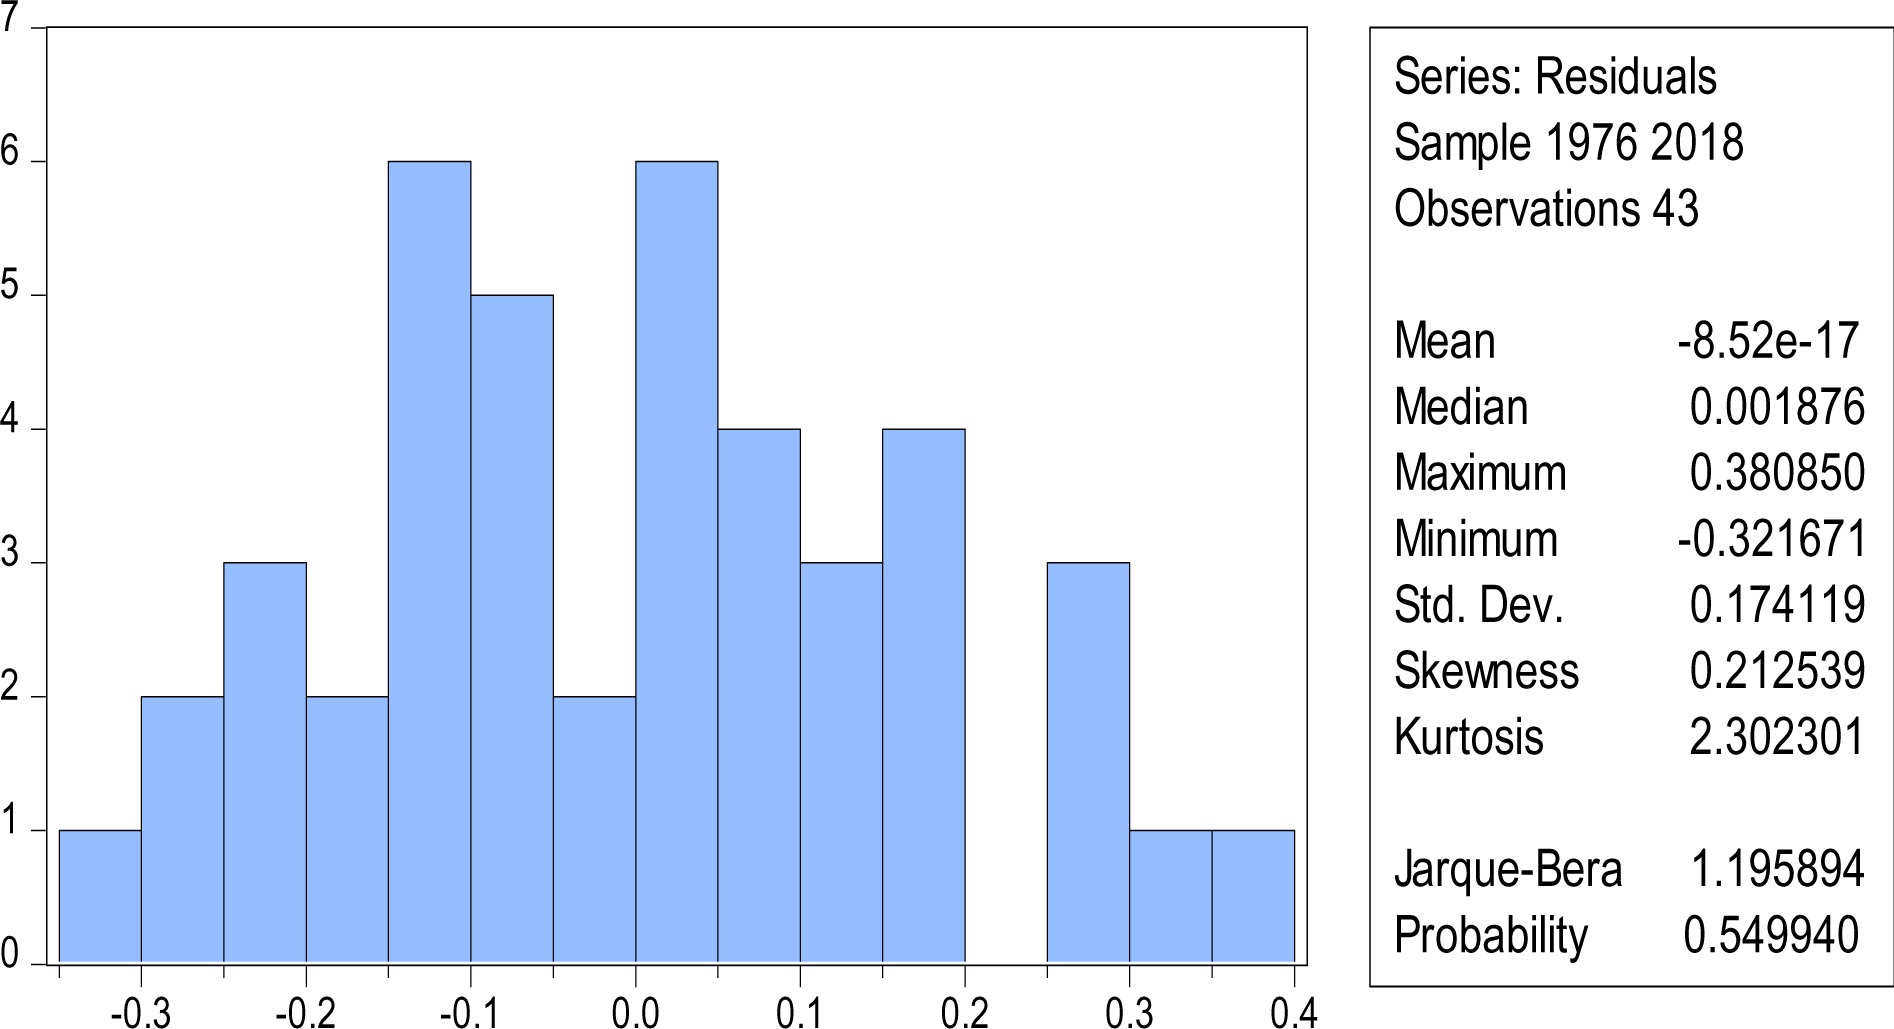
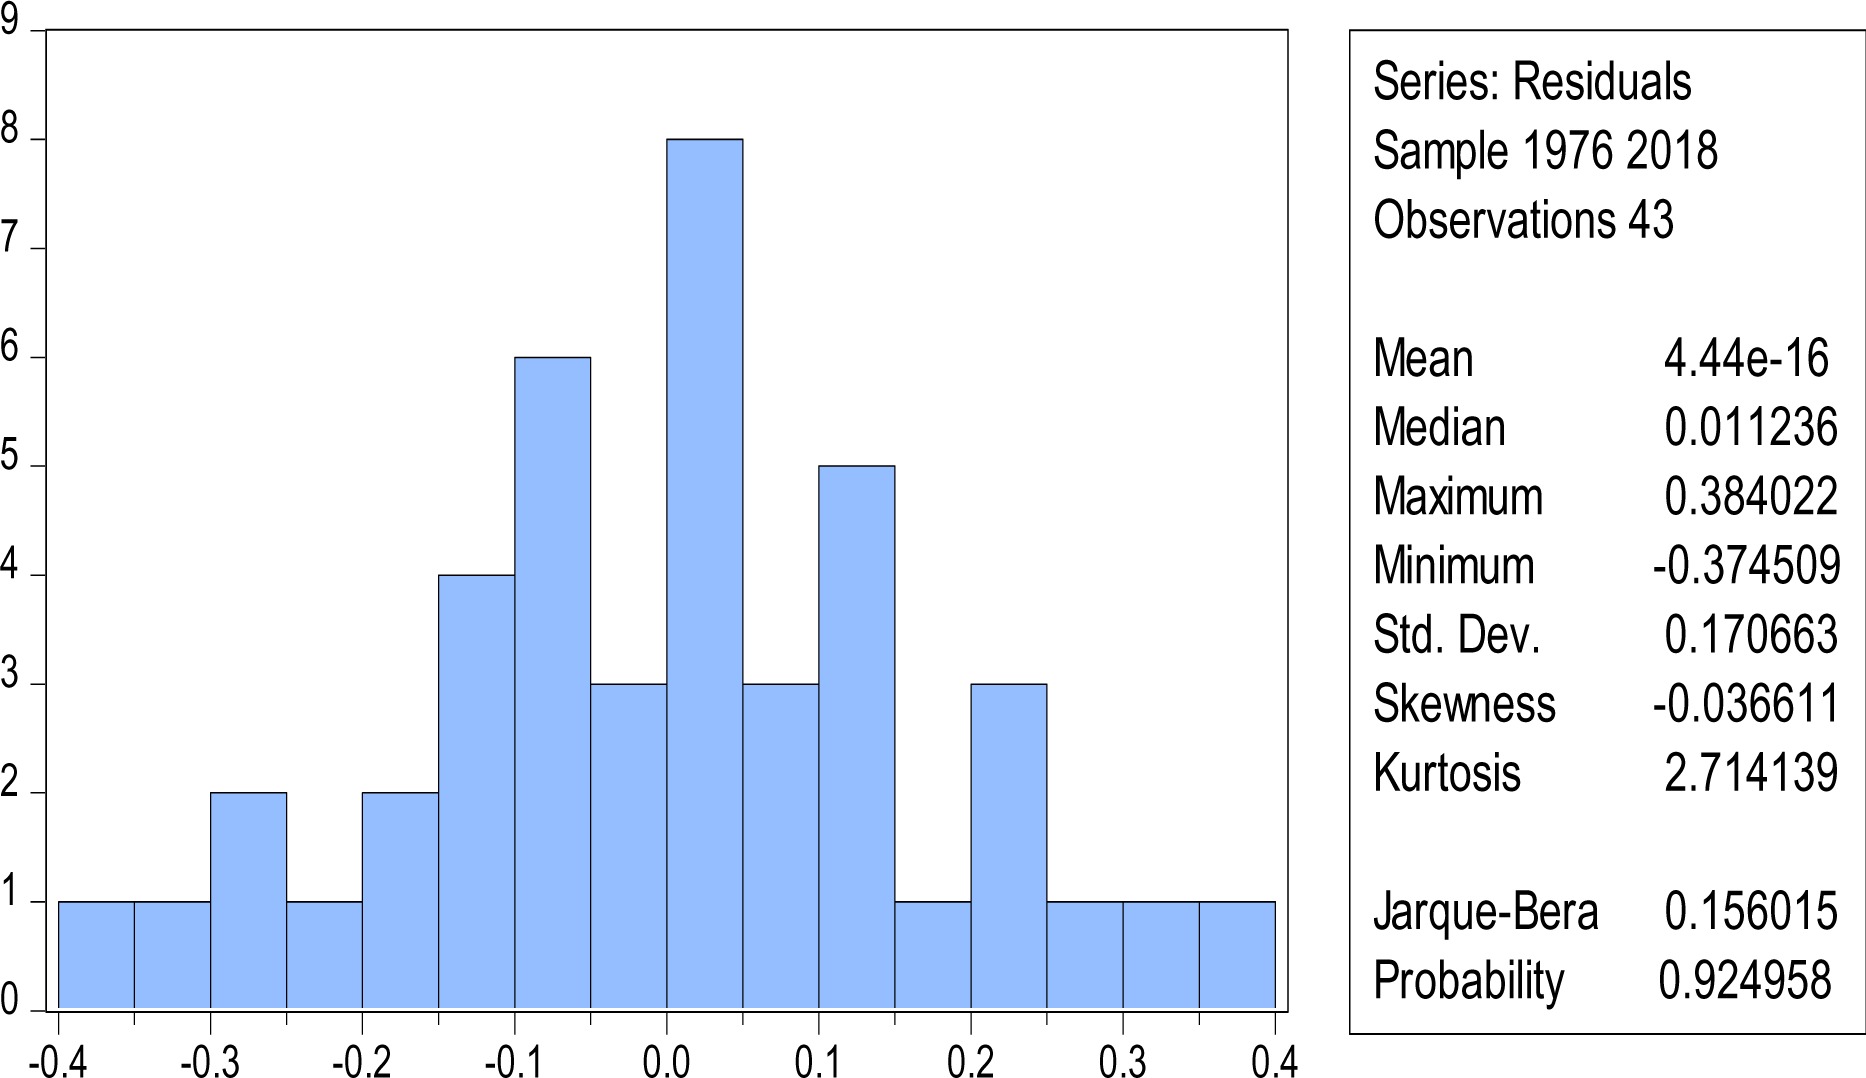
Before discussing our estimates, it is important to establish their reliability, i.e. in the statistical jargon whether they are unbiased, consistent, and efficient. ARDL estimates are unbiased, consistent, and efficient, provided that the residuals have constant variance. To establish that the variance is constant and the residuals normally distributed, we use the following tests:
Correlogram: to establish that the residuals are not correlated over time.
Correlogram of squared residuals: to establish that the variance of the residuals is not changing over time.18
The Breusch–Pagan–Godfrey test: to establish that the variance is constant.
The Jarque–Bera test: establish that the residuals are normally distributed.
Detailed results of these tests can be found in Appendix A. Clearly, the hypothesis of constant variance, normally distributed residuals cannot be rejected at any reasonable level of confidence. Therefore, we are certain that our estimates are unbiased, consistent, and efficient.
The results presented in the long-run versions of the equations (Tables 3 and 4 above) show that all determinants are significant in explaining the behaviour of the demand for defence equipment and bear the expected sign. More specifically, commenting on each determinant separately, we start with the behaviour of equipment procurement to changes in LTURDEF (a variable including both the property and human resources of Turkey). The derived coefficient is close to unity, bears a positive sign and must be interpreted as corresponding to that derived for the variable representing the threat in conventional estimates (e.g. Dunne et al., 2003, pp. 447-460; Kollias and Paleologou, 2003, pp. 437-445). In such cases, however, the coefficient assumes lower values, ranging between 0.2 and 0.7. This is expected, given that most of the sources in the literature do not make a distinction as regards the nature and time dimension of threat. It is interesting to see that when the threat variable is decomposed to represent property and human resources (LTREQ and LTRPOP respectively), the reaction of the dependent variable to changes in the two components is positive, albeit different in terms of elasticity. More specifically, the coefficient is inelastic in the former case (0.58) and remarkably consistent with similar earlier work (Katsaitis et al., 2019, pp. 177-201) but turns out to be elastic in the case of human resources (about 1.5), indicating the importance attached to the ally-adversary’s human resources endowment by the Greek side.19 In fact, this estimate indicates that the Greek defence doctrine is much more concerned with the long-run developments on the Turkish human resources side rather than the equipment purchased by the ally-adversary. This is to be expected if one compares the impressive rates of Turkish population growth to those of Greece, the corresponding figures of which have started to become negative over the last few years.
As regards the importance of the NATO alliance to the Greek defence equipment procurement, as represented by SPILL, the derived coefficient is significant and positive indicating the absence of any form of free-riding policies.20 In fact, the derived coefficient is in line with the pronounced commitment of Greece to her alliance obligations with the elastic coefficient being higher than most sources in the literature on this issue (between 0.3 and 1.3 in e.g. Dunne et al., 2003, pp. 447-460 and Kollias and Paleologou, 2003, pp. 437-445).
Finally, we turn our attention to the coefficient of DOGS and α, the coefficient of adjustment. The coefficient of DOGS is positive, indicating the tight short-run margins allowed to the Greek side to increase its defence equipment. The speed of adjustment coefficient, α, (about -0.8) in Tables 3 and 4 is highly significant and points to an adjustment period of slightly more than one year.21
Concluding this discussion on the results derived, we need to point out that the reliability of these estimates is further supported by the fact that our method of estimation captures the actual Greek defence spending behaviour without resorting to the help of any dummy variables to interpret the effects of major political or geostrategic events. Attention is drawn, however, to cases in which our estimates may be compared to those encountered in the literature thus far due to the different approach used herewith.
5.2. Policy Implications
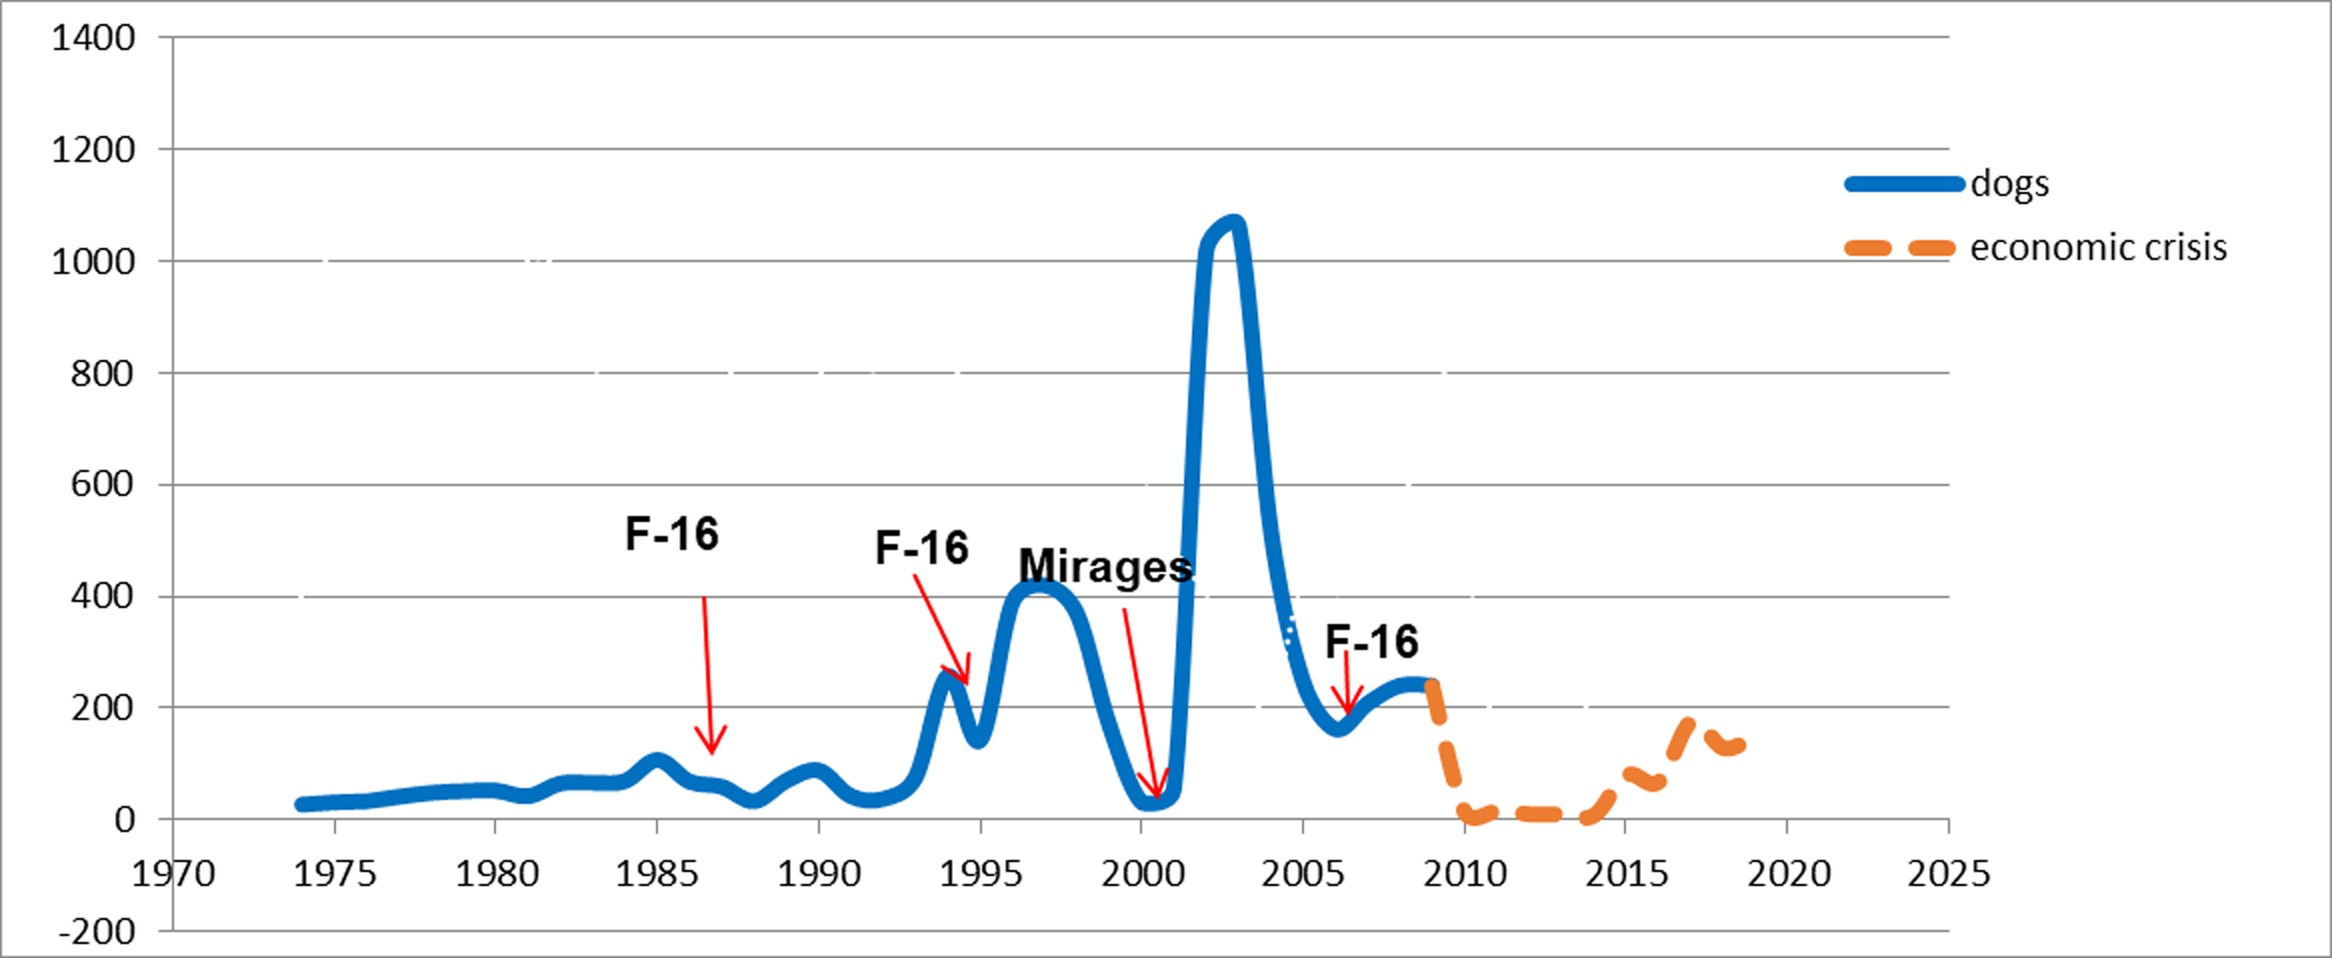
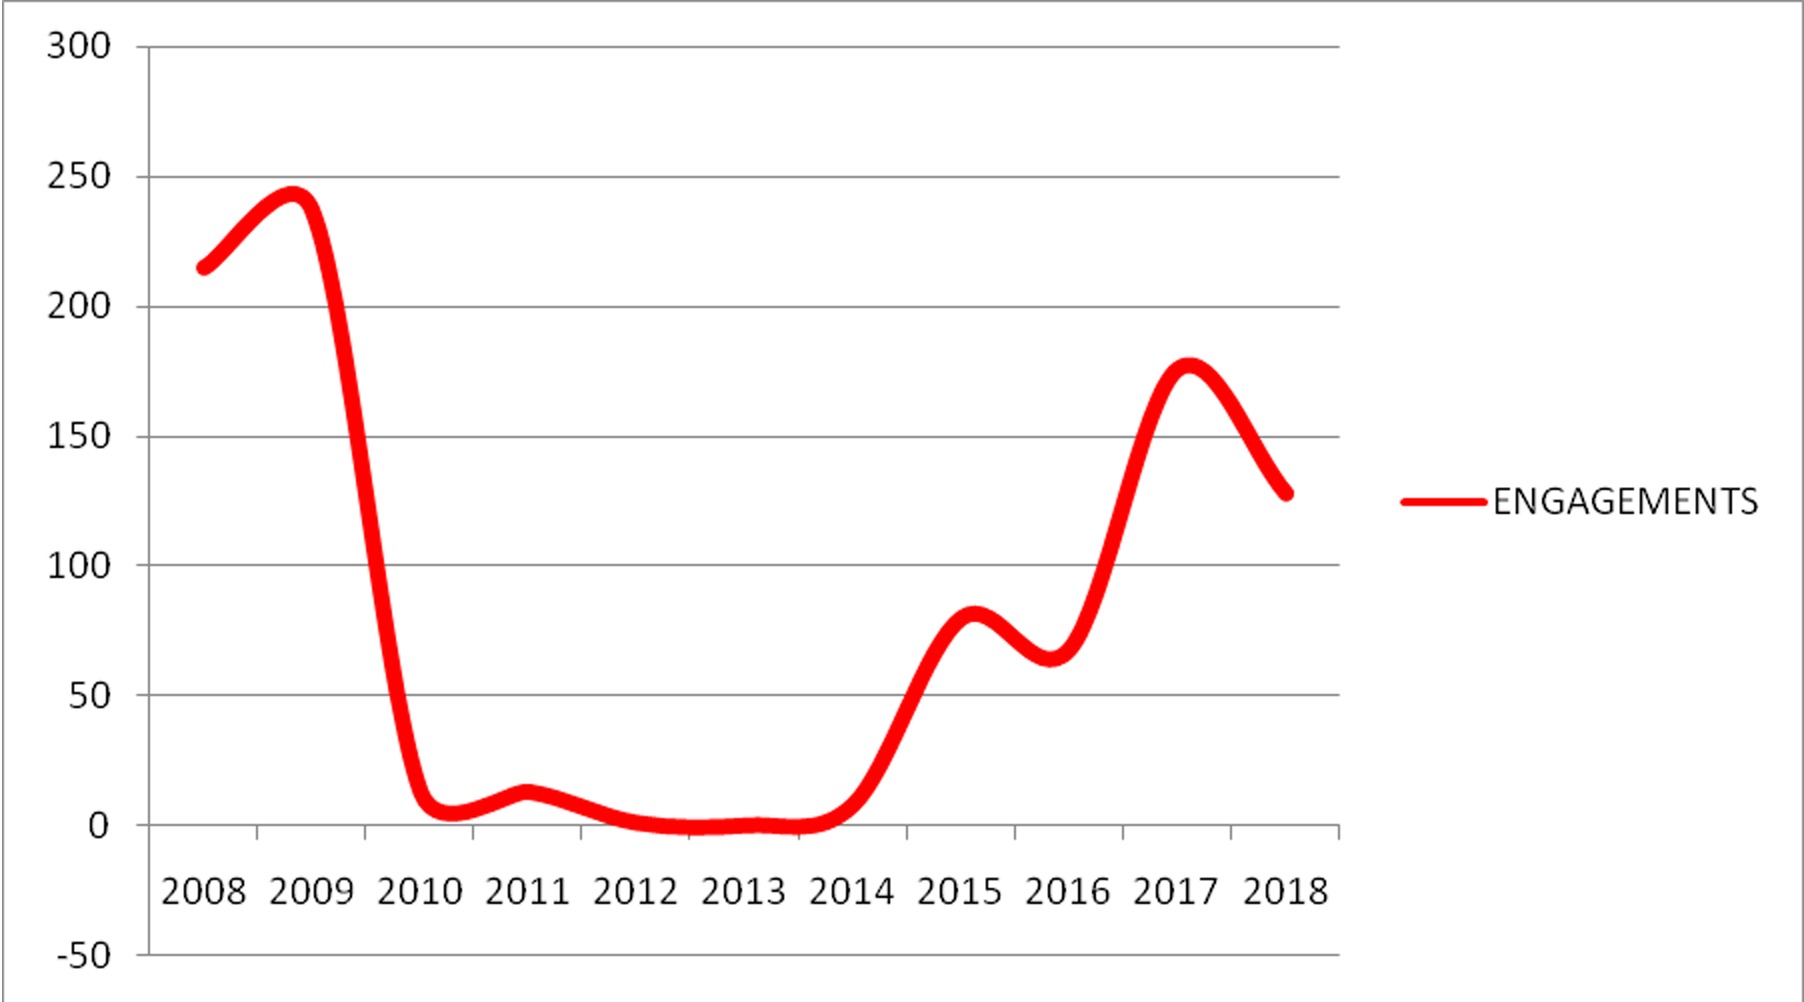
One of the main issues of the paper is to highlight the measure of alliance sub-optimality, approximated by the number of daily engagements between HAF and THK fighters when the latter attempt to violate Hellenic air space as this is seen from the Greek side (Figures 2 and 3). As pointed out in Section 3, this is clearly an adjustment reaction and any additional procurement (over and above the purchases provided in the 5-year procurement programmes – EMPAE) following such attempts indicates the extra cost to the adjustment/corrective process to restore long–run equilibrium in our alliance model.22 Thus, we argue that the role of this specific variable in the analysis is to approximate the degree of sub optimality and, consequently, the loss of efficiency suffered by Greece while incidents of friction with Turkey, an alliance member, continue.
Figure 2 highlights the effect of the HAF and THK engagements as a sub-optimality measure of the alliance. It also indicates the extra fighter purchases of F-16s and Mirages acting as an accelerator to the error correction mechanism aimed at restoring the long run equilibrium and providing a measure of the cost suffered by Greece to do so. Note that as provided by our model, this error-correction mechanism operates with a lag of close to two years, following the peaks of the engagement figures.23
More specifically, following the Greek–Turkish 1985 crisis and a local maximum of the number of engagements, Greece purchased two batches of Mirages and F-16s a couple of years later. About two years after the period 1994–1999 and the prolonged friction between the two sides, Greece placed an order for an additional batch of F-16s followed by an order for Mirages in the year 2000. With the turn of the century, the number of engagements increased dramatically assuming a global maximum in 2003, followed by the last F-16 batch purchase in 2006. Based on this behaviour, therefore, one can safely argue that the engagements accelerated defence spending.
Figure 2
Annual HAF and THK Engagements Measure Alliance Sub-Optimality: Extra Procurement Acts as an Error-Correction Mechanism Restoring Convergence
Source: HAF, NATO, Hellenic Ministry of National Defence
The economic crisis of 2010 to 2019 is an interesting period to discuss, as there are no equipment purchases, following the “Troika” guidelines and despite the continuing aggressiveness from Turkey. In fact, there are sources in the literature (Pitsoulis and Schwuchow, 2014, pp. 697-707) which tend to attribute the absence of any form of reaction from Greece (equipment purchases or even just engagements) to the lack of resources following the 2010–2019 financial crisis. They argue that Turkey “contributed” to this lack of resources with its continuous pressure leading to Greece’s economic exhaustion. In fact, they state that “not only Greek engagements with Turkish intruders, but also massed, provocative Turkish intrusions were significantly less likely after the onset of the Greek economic crisis.” As pointed out earlier, this view has gained supporters in the literature (Kollias et al., 2016, pp. 28-34) claiming that “in other words, the economy is a formidable constraint that supersedes security needs and challenges.”
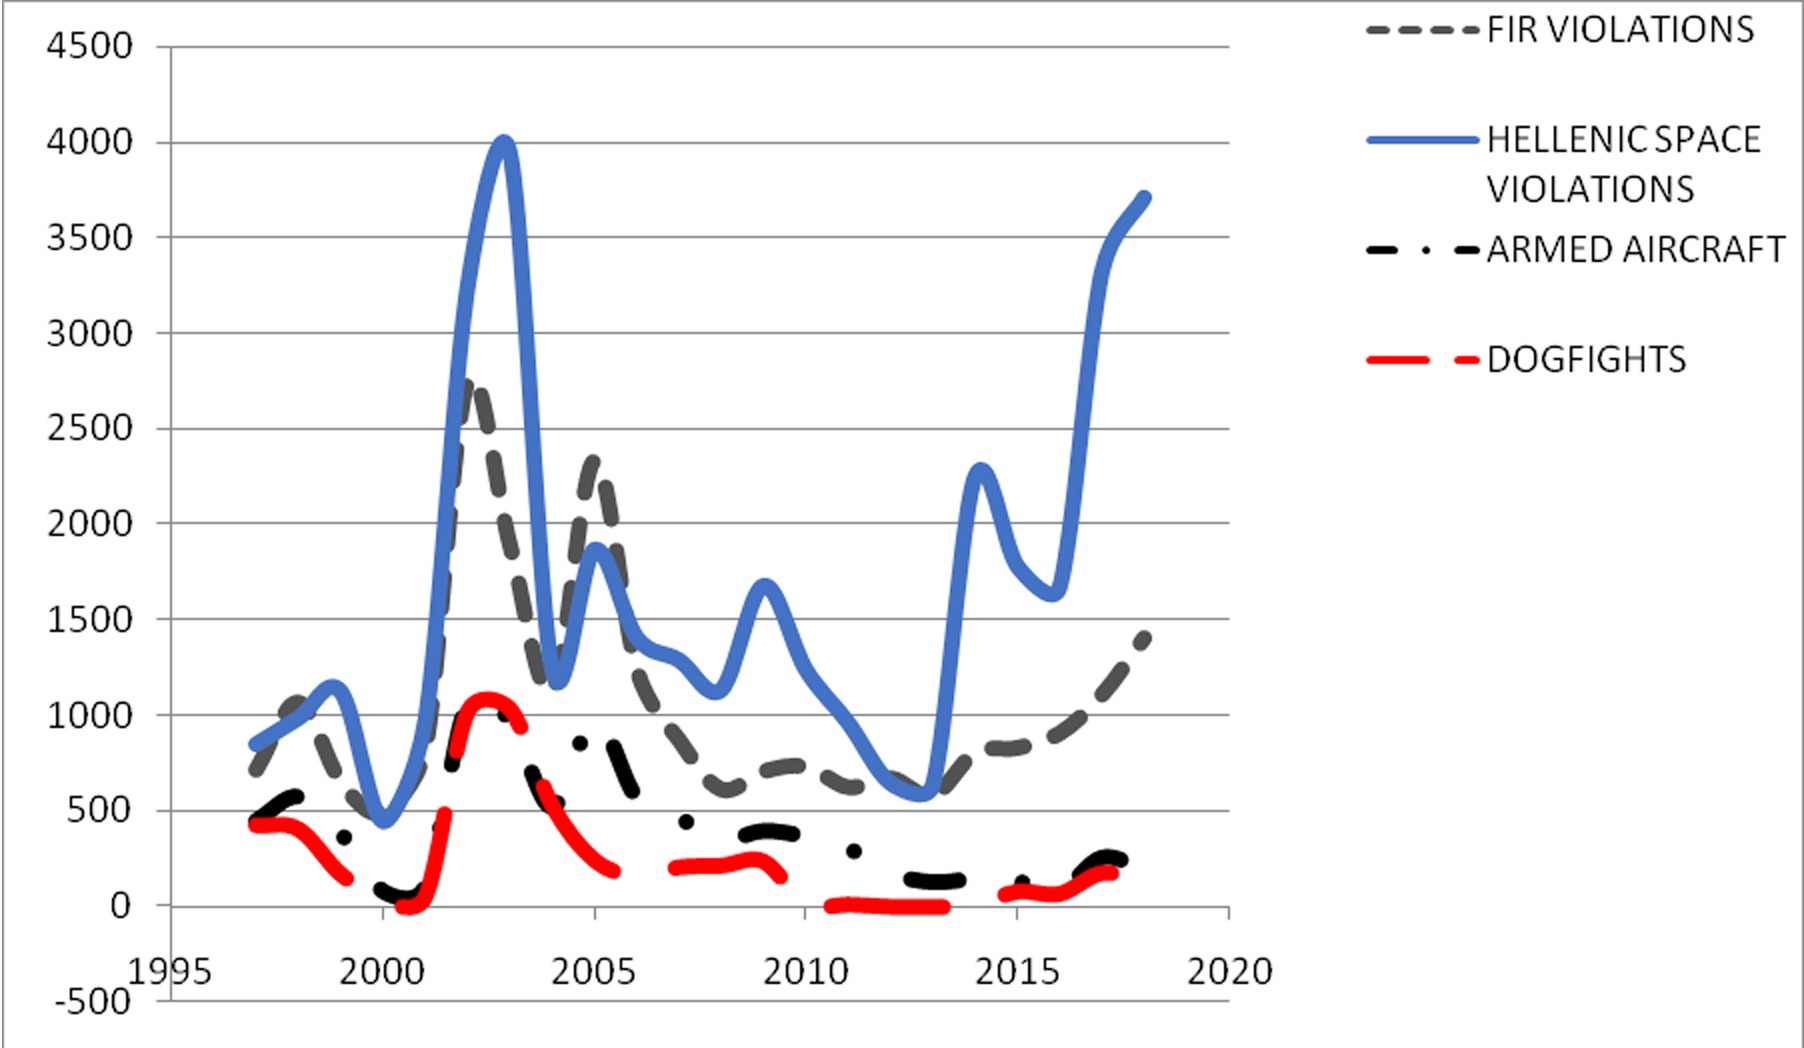
To the extent that such an approach implies that the continuous pressure exercised by Turkey is intended to bring the Greek economy to its knees, facts and figures prove that it is a rather superficial consideration for the specific case. To begin with, we have already shown, both in this paper (Table A3) and in earlier work on the topic (Katsaitis et al., 2019, pp. 177-201), that with reference to the case of Greece, the income variable does not represent a procurement constraint under the present circumstances, especially in the short run and in an environment of extensive and persistent threat. In addition, these views have been based on data up to and until 2015, when the Syrian entanglement of the Turkish armed forces between 2011 and 2015 was ended. It is therefore reasonable to argue that placing emphasis on both fronts reduced the pressure in the Aegean during that period, at least to a certain extent. Since 2017, however, with Turkey conforming with the Russia-Syria Agreement, many experienced pilots were released to return to the Aegean front, this causing the number and intensity of such forms of pressure to be exercised in increasing tension until today with the Greek crisis over (Figure 4). Finally, the direct24 annual cost of such engagements for the Greek side amounts to about €15 million at most.25 This is a rather low price to pay for two-minute readiness annual drills of the Hellenic Air Force, which keep its pilots in top shape. The only explanation left to consider, therefore, concerning the absence of additional defence equipment purchases is the political cost involved in such cases, which discourages governments to purchase additional defence equipment.
6. A Forecasting Exercise
Concluding with the section of policy implications, we thought that it would be appropriate to embark on a forecasting exercise given the encouraging results of the recursive regression exercise shown in Figure A1. The values assumed by the explanatory variables have been input as follows: The TREQ figures are based on the provisions of the $150 billion long-term (2000–2025) procurement programme of the Turkish armed forces, while the DTRPOP figures retain the current year growth rate for the forecasted period.26 Finally, the SPILL figures assume that the NATO spending figures as a GDP percentage will remain broadly stable for the forecasted period.
Figure 5
Greece: Defence Expenditure on Equipment (GREQ) Projections (% GDP)
Source: NATO, Authors’ Projections
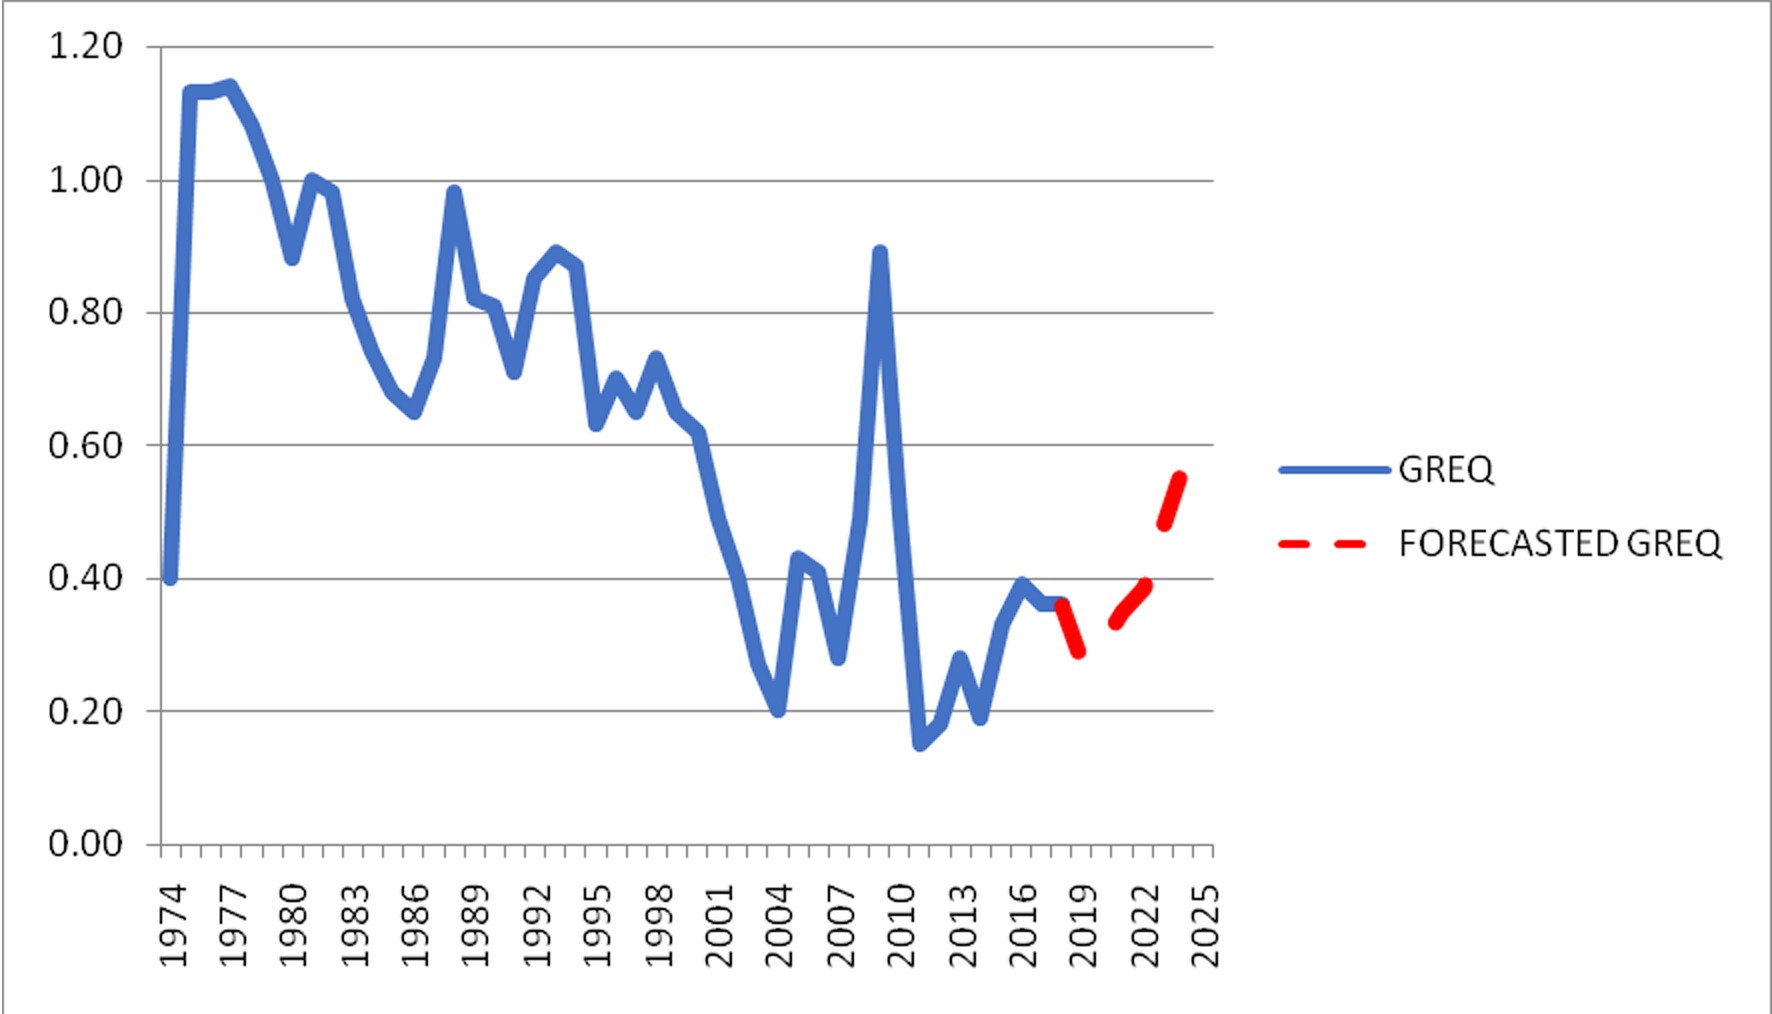
The forecasted defence spending on equipment as a percentage of GDP for Greece speaks for itself (Figure 5): Despite the fact that, as already pointed out, the income constraint has not been binding in the atmosphere of an arms race against Turkey, Greece has not been allowed to invest for its future national defence needs, following, in parallel, the International Monetary Fund (IMF), European Union (EU) and European Central Bank (ECB) requirements for irrationally high budget surpluses (see e.g. IMF 2014). Given this very demanding background and the developments in the Eastern Mediterranean, as well as the threats in the Aegean, Greece faces the danger of paying the cost of its populist politicians adhering to the “guns versus butter” approach opting for the latter. But as things stand now, our forecast for defence equipment purchases points to a maximum of a mere 0.6% of the GDP as an answer to the recent procurement provisions of the impressive long-term Turkish defence procurement programme (Appendix B). Translated to absolute figures, this forecast involves spending about €0.5 to €1.0 billion per year mainly for extensive modernisation of the Hellenic fleet, figures that are barely adequate for achieving such a target in the allotted time.
7. Summary and Conclusions
The aim of this paper has been to assess the extent of friction introduced in an alliance environment and the inevitable cost incurred when two of its members resort to the extreme option of continuous aggressive behaviour, as indicated in Section 3.1. Using the case of Greece versus Turkey, we have modified the typical defence expenditure function of the former to include an accelerator to the error-correction mechanism that assesses the cost due to such friction. This is approximated using the daily engagements of the Hellenic Air Force (HAF) fighters against the corresponding THK when attempting a violation of the Greek airspace as the Greek side considers it. To this end, we have modified the traditional defence spending function for Greece as it appears in the literature, in order to provide a dynamic dimension to its long-run static Nash equilibrium environment. In the context of this modification, we consider the daily engagements and the acquisition cost of the additional defence equipment involved in such cases, to approximate the degree of sub optimality and, consequently the loss of efficiency suffered by the NATO alliance while frictions between Greece and Turkey continue. We believe that this specification and estimation method reflects the actual picture much better than most of the literature sources, a fact supported by the absence of any dummy variables representing political geostrategic events.
In this context, we show that engagements accelerate defence spending, a cost which leads to a waste of resources, threatens NATO cohesion, and prevents it from focusing on common external threats that are clearly evident. Thus, cases in which commitment to NATO is weakened due to a member’s hostile attitude or, even worse, cases in which a member state employs defence equipment manufactured by the country which until now has been considered as an external threat do not exactly contribute to NATO cohesion. Greece’s irregular, but frequent disturbances de-trend the Greek defence policy and represent the adjustment cost suffered by this type of threat. In cases in which such a threat originates from external sources, then the alliance’s members would be expected to contribute to the cost incurred along the lines provided by Article 5 of the NATO Treaty. The problem for Greece is that in her case, the threat is internal with reference to the alliance and, as such, there is no contribution to be expected from its allies, either individually, or as a NATO entity collectively. In this case, therefore, this adjustment cost is borne exclusively by the country which suffers assault, namely Greece.