
Introduction
The role of societies and their perceptions is a central element of the national security of every country. It is even more important in democratic societies – not just because the accountability of state institutions vis-à-vis societies is stronger and national security policies are subject to public opinion, but also because of the intrinsic vulnerabilities of democratic societies to intentional and unintentional external influences. An adversary can use various tools to influence public opinion, even more so in the digital age when access to individuals is easier than ever before. If such measures are successful, inhabitants of the target country might be less willing to defend their countries and to show resistance if their countries are occupied. This underscores the need to understand both the atmosphere in societies, as well as to plan and conduct measures to prevent external actors from succeeding in information and other operations.
The Baltic states provide a peculiar case for studying the willingness of their inhabitants to defend their countries and to resist an adversary should they be attacked. All three countries have jittery relations with Russia. The latter is undoubtedly seen as a paramount source of risks to their national security, as exemplified by their basic national security documents (Seimas, 2017; Riigikogu, 2017; Saeima, 2019). Furthermore, all three constantly express concerns about Russia’s attempts to influence the perceptions of their societies in a way that Russia’s authorities would find beneficial.
This article starts with a review of other Baltic-centric studies and an introduction to the research approach and methods. That paves the way for presentation and analysis of the quantitative data – firstly on the willingness to defend the three countries, which is followed by the willingness to resist and how if the country was to be attacked.
The main advantage of this article is the provision of methodologically consistent nationally representative data from all three Baltic countries at the same time. Most of the other Baltic-centric researches relied on data acquired by different methodological approaches in diverging periods (e.g. Rutkauskas, 2018), or data on one Baltic country (e.g. Vileikienė and Janušauskienė, 2016; Bērziņa and Zupa, 2020). Furthermore, the data not only provides a picture of the perceptions in the societies at large, but also portrays opinions along demographic lines.
Baltic states in the current research agenda
The situation in the Baltic states has been explored in various global and regional-level surveys. At least one of the Baltic societies has been surveyed in the 1990 and 1999 surveys of the European Values Study. Results for all three countries from 1990 revealed a high level of willingness – over four-fifths in all three (97.4 % in Latvia, 92.1 % in Estonia and 83.7 % in Lithuania); the 1999 edition only surveyed Lithuania, recording 72.1 % (European Values Study, 2013a, p. 561; 2013b, p. 916). The 1996 and 1997 World Values Survey data recorded willingness to fight for their own country at 61.3 % in Estonia, 54.5 % in Latvia and 51 % in Lithuania; the 2011 survey placed Estonia at 51.6 % (Inglehart et al., 2014a; Inglehart et al., 2014b). Another survey of global reach, the WIN/Gallup International Global Survey, assessed the situation in Latvia. It revealed that 41 % of respondents there would be willing to fight for their country (WIN/Gallup International, 2015, p. 2).
State institutions in the Baltics have also ordered surveys on the willingness to defend the respective countries. The publicly available surveys from 2001 to 2019 commissioned by the Estonian Ministry of Defence and by the Latvian Ministry of Defence for the period of 2014 to 2016 are examples. Data from Latvia for the aforementioned period revealed that willingness to defend the country was expressed by between 33 % and 41 % of respondents (SKDS, 2016, p. 42). The more comprehensive Estonian data reveals that willingness to defend the country was in between 54 % and 70 %, with the highest values recorded from 2003 to 2005 (Faktum Uuringukeskus, 2003b, p. 11; 2003a, p. 12; 2003c, p. 12; 2004a, p. 36; 2004b, p. 37; 2004c, p. 21; 2005a, p. 41; 2005b, p. 41; 2005c, p. 51; Saar Poll 2011, p. 27; 2012a, p. 29; 2012b, p. 30; 2013a, p. 30; 2013b, p. 30; 2014, p. 29; Turu-uuringute 2001a, p. 9; 2001b, p. 8; 2001c, p. 8; 2002a, p. 8; 2002b, p. 7; 2002c, p. 9; 2006a, p. 31; 2006b, p. 31; 2006c, p. 42; 2007a, p. 31; 2007b, p. 35; 2008, p. 29; 2009a, p. 25; 2009b, p. 28; 2010a, p. 27; 2010b, p. 36; 2011, p. 30; 2014, p. 28; 2016, p. 29; 2018, p. 32; 2019, p. 39).
The topic has also been the subject of academic interest in the Baltics, focusing on these countries either trilaterally or individually. Rutkauskas (2018) assessed the situation in all three. He mainly relied on the data gathered as part of the European Values Study, World Values Survey and WIN/Gallup International Global Survey, though with additional data on Lithuania. His research thus revealed similar tendencies to the aforementioned primary sources. The supplementary data for Lithuania puts the willingness level at approximately one-third to two-thirds of the respondents (Rutkauskas, 2018, p. 54).
There are several examples of research into individual Baltic states that should be noted. Vileikienė and Janušauskienė assessed data on the situation in Lithuania from several sources. The data, apart from that of the European Values Survey, placed the willingness level in Lithuania at between 32 % in 2005 and 57 % in 2014 (Vileikienė and Janušauskienė, 2016, p. 126). Meanwhile, a willingness level of 42 % in Lithuania was recorded in research by Ramonaitė, Petronytė-Urbonavičienė, Skirkevičius and Vosylius (2018).
Andžāns, Sprūds and Bruģe (2017, pp. 17–18) presented data from a dedicated nationally representative survey in Latvia. They concluded that the results from that survey – 45.3 % – fell beneath the average global level. A nationally representative survey as part of the study of Bērziņa and Zupa (2020, pp. 4–5) revealed that 31 % of Latvians would be ready to defend their country if there was a military attack, thus ranking Latvia among countries with a rather low willingness to defend one’s own country. Although a question on willingness to defend Latvia by non-military means put that level at 55 %.
Although the methodologies of the aforementioned studies differ, they tend to provide a generally consistent picture on willingness to defend the Baltic states. Willingness to defend one’s country in the Baltics was higher in the first decade after independence. More recent data consistently demonstrates higher levels in Estonia, while Latvia and Lithuania fall behind in this respect.
Approach and methods of the study
For purposes of this study, a nationally representative sociological survey was conducted in all three Baltic States in November and December 2019. Interviews in Latvia were conducted by SKDS (from 28 November to 8 December), in Lithuania by Baltijos Tyrimai (from 14 to 27 November), and in Estonia by Turu-uuringute (from 28 November to 8 December).
Across all three countries, 2763 respondents aged from 18 to 74 completed interviews (870 of them in Estonia, 1001 in Latvia, and 892 in Lithuania). The respondents were identified with the multi-stage proportional representation method. The demographic background of respondents included gender, age group, education level and language spoken in the family.
Two questions were put to each respondent. First – “if [Latvia, Lithuania or Estonia] were attacked, should inhabitants of [Latvia, Lithuania or Estonia], in your opinion, take up arms to defend themselves in all situations, even if the outcome seemed uncertain?” Second – “if [Latvia, Lithuania or Estonia] were attacked, what would you most likely do?”
The next chapter will focus on an analysis of answers to the first question (willingness to defend the country), while the following one will address the second question (willingness and ways to resist). After assessing data on entire samples, the same data along demographic lines will be visualised and vetted.
On the one hand, the data gathered and presented here has certain limitations. As an outcome of a single survey, they present a snapshot of the situation at the time of their gathering. Therefore, one should be careful with generalisations. On the other hand, this data is principally consistent with tendencies unveiled by other similar studies (most of them were outlined in the introduction, and it will be explained in the latter parts of the paper). On top of that, this study provides comparable and representative data as polling was conducted according to the same methodology and in an almost identical period.
Willingness to defend one’s country in the Baltic states
The first question asked in the survey was “if [Latvia, Lithuania or Estonia] were attacked, should inhabitants of [Latvia, Lithuania or Estonia], in your opinion, take up arms to defend themselves in all situations, even if the outcome seemed uncertain?” Each respondent could choose one predefined answer – “certainly yes”, “rather yes”, “rather no”, “certainly no” or “hard to say”.
Figure 1 shows the data from all three Baltic states with regard to all respondents surveyed. The highest contrast can be observed between Estonia and Lithuania. Data from the first country demonstrates the greatest willingness to defend the country, whereas data from the second provides the lowest values. 38.3 % of all respondents in Estonia expressed definite approval of the question (“certainly yes”) and 28.3 % fair approval (“rather yes”) (66.6 % as a cumulative value). In Lithuania, only 4.2 % of respondents gave a definite positive answer to the same question, along with 25.7 % giving fair approval (29.9 % altogether). The situation in Latvia was in the middle with 20.5 % and 28.5 % positive answers accordingly (or 49 % as a cumulative value).
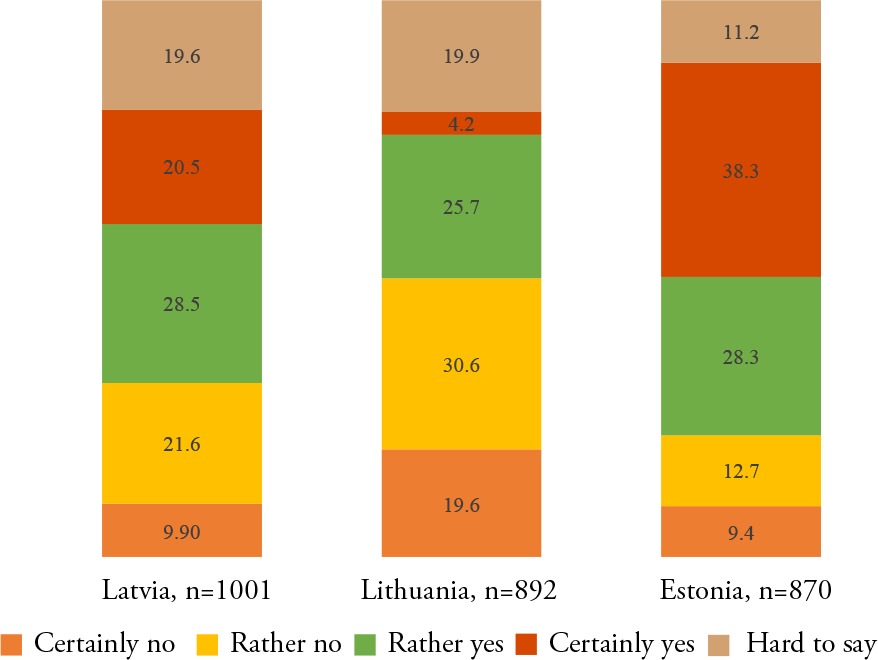
Similar and adverse trends can be observed with the number of those respondents expressing no willingness to defend their country. The lowest such numbers are in Estonia (9.4 % saying a definite no and a further 12.7 % saying rather no (22.1 % in total)), but the highest such numbers in Lithuania (19.6 % definite no and 30.6 % rather no, or 50.2 % in total). In Latvia, the respective numbers are 9.9 % and 21.6 % (31.5 % in total).
Attention should also be devoted to the undecided respondents. The lowest number of undecideds were in Estonia (11.2 %). There were almost twice as many undecided respondents in Lithuania (19.9 %) and Latvia (19.6 %).
Data on the demographic background of the respondents provides a more detailed picture. It provides an insight along the lines of gender, age, main language spoken in the family, as well as the education level of respondents.
In the deliberations that follow, more attention is given to the trends that cannot be directly seen from the figures, thus in part avoiding duplication of the visuals and words. More emphasis is placed on the affirmative values (willingness to defend) as it is similarly placed in the forefront in various global level studies (e.g. WIN/Gallup International, 2015, p. 2). In other words, how many individuals are willing to defend their country, not how many are not willing to do so.
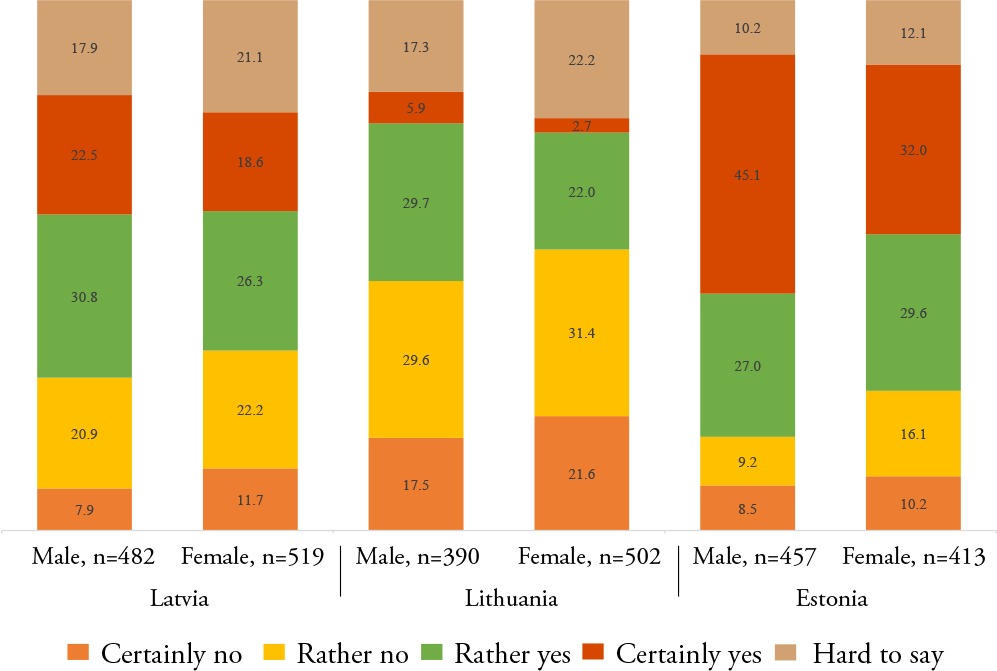
Figure 2 shows the data dividing individuals by gender. In all three countries, male respondents expressed willingness to defend their country more often than women did. Trends across all three countries are similar in terms of the difference between men and women giving cumulative affirmative answers: 10.6 % higher in Estonia, 10.9 % in Lithuania and 8.4 % in Latvia (in other words, the percentage is approximately 10 % higher when data between male and female respondents is compared). Curiously, a higher percentage of women in Estonia expressed willingness to defend their country than the percentage of men in both Lithuania and Latvia.
Data in terms of age of the respondents is not visualised in this article due to the large amount of information (it provides separate data in age groups from 18 to 24, 25 to 34, 35 to 44, 45 to 54, 55 to 63 and 64 to 74). Results from Latvia are more balanced as in all of the pre-defined age groups, cumulative willingness to defend the country is above two-fifths; the highest level was registered among those aged from 45 to 54 (54.7 %), while the lowest among those aged from 64 to 74 (43.3 %). Meanwhile, data from Lithuania demonstrates that the highest cumulative levels of willingness are among the youngest respondents, aged from 18 to 24 (39.6 %), while the lowest among respondents in the age group of 55 to 63 (20.1 %). Data from Estonia, as opposed to Lithuania, suggests that the elderly are the most willing to defend their country. There, 74.4 % of those aged 64 and above provided an affirmative answer. The lowest percentage of cumulative positive answers, yet demonstrating a decent level of willingness, came from respondents aged from 18 to 24 (54.3 %).
Figure 3 shows data based on the language spoken in respondents’ families – these were Latvian, Lithuanian, Estonian, or Russian. Attention to this perspective is necessary given the often-observed different opinions among Russian-speakers on such issues as the foreign and defence policy of the Baltic states. For example, a research and an underlying nationally representative survey in Latvia revealed contrasting perceptions of the friendliest/non-friendliest countries and their leaders. Among Russian speakers, the most non- friendly country was the United States (to be fair, Russia came second), while the president of Russia would enjoy the highest trust should a crisis occur (Andžāns et al., 2017, pp. 30, 28). The reality is more complex than that, and this study aims to give a further insight in the issue of polarisation of these societies.
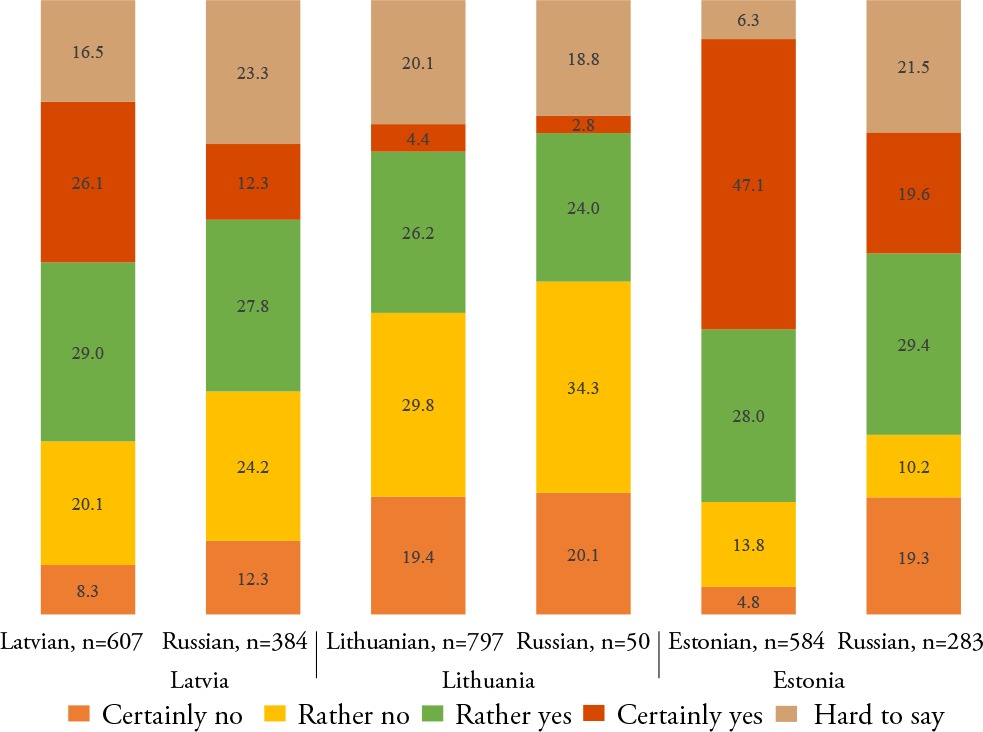
From this perspective, the highest contrast can be seen in Estonia, where the difference in willingness to defend the country among Estonian-speakers and Russian-speakers stands at 26.1 % (the difference among cumulative positive answers in one and the other group). In Latvia, the number is 15 %. In Lithuania, the difference among respondents speaking either Lithuanian or Russian in their families is the lowest of all three – 3.8 %. The case of Lithuania differs from the other two countries given the overall smaller number of Russian speakers there, which accordingly resulted in the smaller sample size of Russian speakers in this survey (50 respondents).
Even though there is a notable difference in two of the countries, the level of those respondents speaking Russian in their families and willing to defend their countries is, nevertheless, not low: 49 % in Estonia, 40.1 % in Latvia.
The final figure of this chapter, no 4, shows the data on the education level of the respondents. In a cumulative perspective, the most willing to defend their country in all three countries are those with secondary or secondary professional education. The biggest difference among categories of different education levels was observed in Lithuania, where a considerably smaller number of respondents with basic education were willing to defend their country, compared to the other two categories.

While the first question addressed the willingness of respondents to defend their country, the next chapter will explore a related, though separate issue of willingness and form of resistance, should the situation assumed in the first question materialise.
Willingness and forms of resistance in the Baltic states
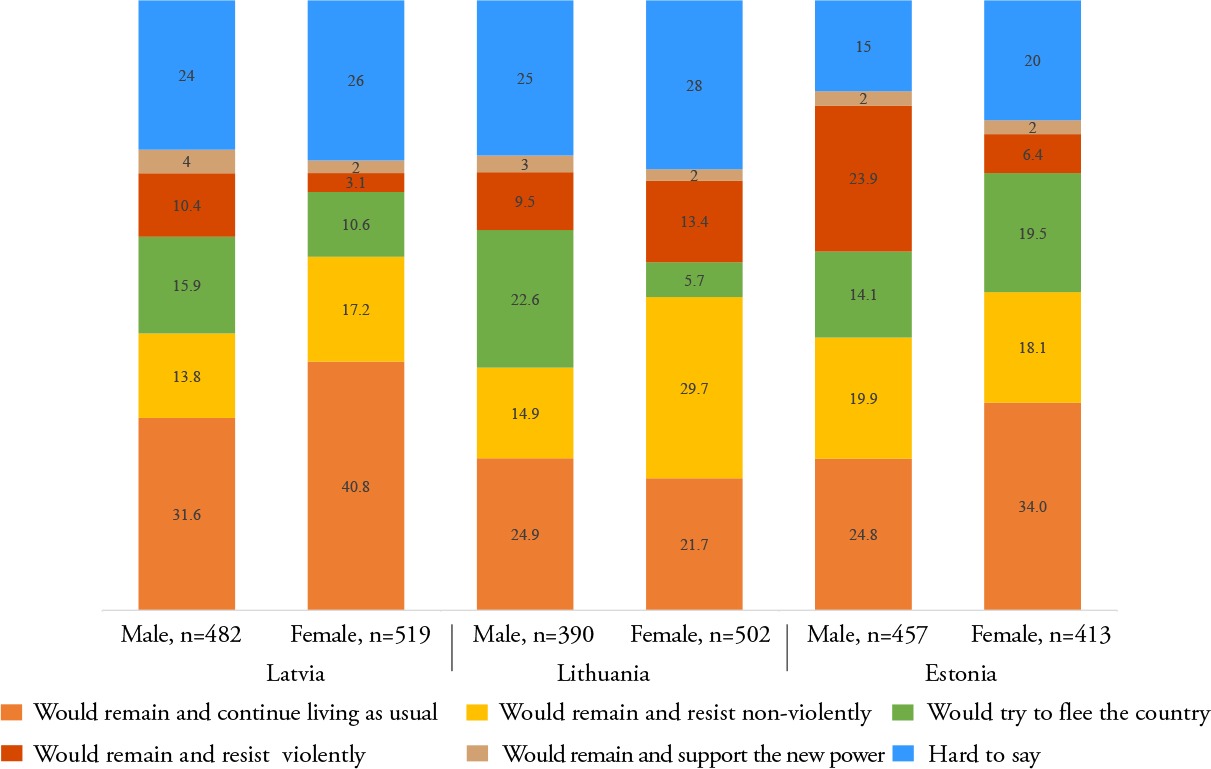
The second question put to each respondent of the survey was “if [Latvia, Lithuania or Estonia] were attacked, what would you most likely do?” The pre-defined answers proposed to respondents were “would remain and continue living as usual (would neither collaborate nor resist)”; “would remain and resist non-violently (e.g. taking part in protests)”; “would try to flee the country”; “would remain and resist violently (e.g. by attacking the new authorities)”; “would remain and support the new power (e.g. by participating in the work of the new authorities, by assisting with ensuring order)”; and “hard to say”. For space saving purposes, the parts of the answers in the brackets are deliberately omitted from the figures that follow in this chapter.
Figure 5 shows the data on all respondents participating in the survey. Compared to the first question, more respondents had difficulties in providing an answer to this question. Similar to the first question, the number of undecideds is the lowest in Estonia.
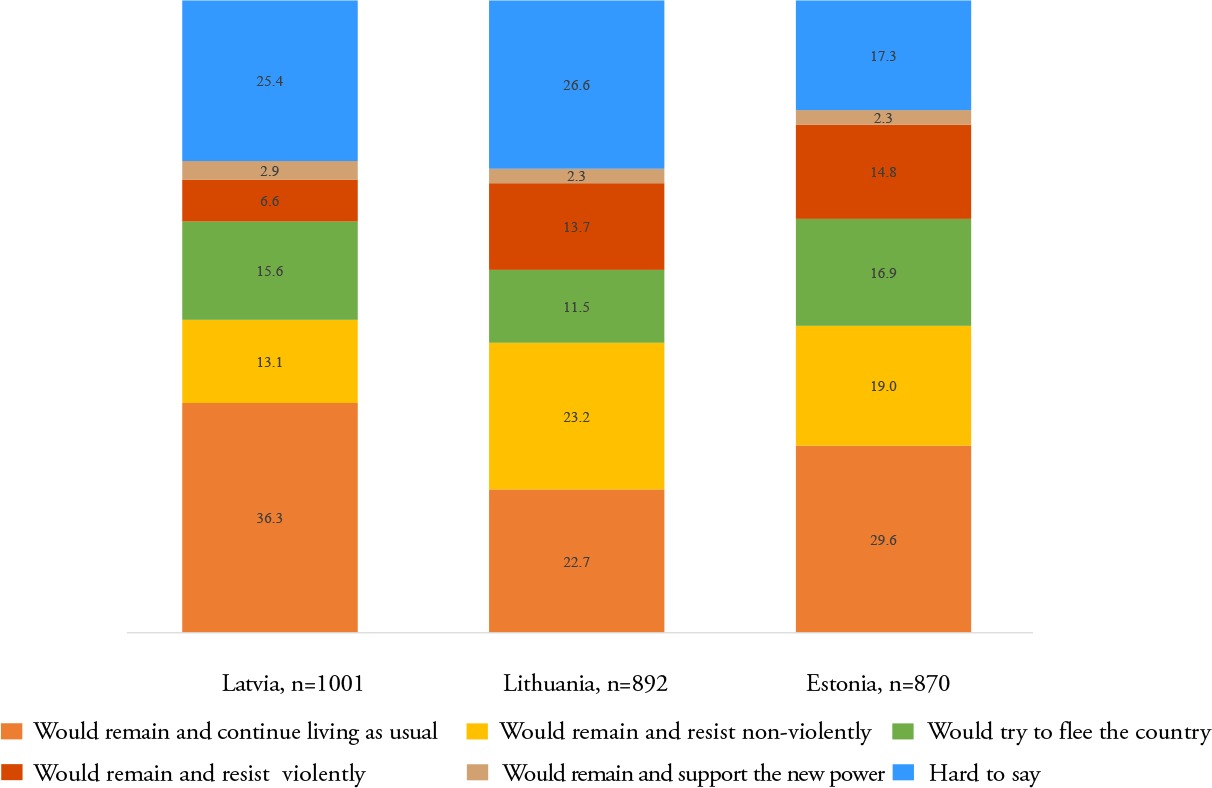
Among all respondents, the highest cumulative level of willingness to resist was registered in Lithuania (36.9 %), ahead of Estonia (33.8 %). The number in Latvia was 19.8 %. Data from Latvia also reveals the lowest values in both violent and non-violent resistance forms.
As Figure 6 demonstrates, compared to Latvia, in both Lithuania and Estonia there would be twice as many those willing to resist violently. The highest percentage of those ready to live as usual was recorded in Latvia. The level of those that would support a new hypothetical power was equally low in all three countries – below 3 %.
In the explanations that follow, we focus on the willingness to resist, either violently or non-violently; nevertheless, the contrary values are not entirely neglected.
Figure 6 shows the data divided by gender. In Latvia and Estonia, any form of willingness of resistance was more frequently expressed by men, while the situation was the opposite in Lithuania. In other words, more women than men would be ready to resist both violently and non-violently in Lithuania. In Estonia and Lithuania, the respective difference in percentage between genders (willing or not willing to resist) is almost twofold, while it is more balanced in Latvia.
In the same manner as in the previous chapter, data regarding the respondents’ age is not visualised due to the amount of information generated by multiple age groups. Data from Latvia suggests that the most willing to express any manner of resistance are the youngest adult members of the population (aged between 25 and 34, with a cumulative willingness level of roughly 34 %), while the willingness to resist becomes lower among older people (the lowest among respondents aged above 55 – around 12 %). In Lithuania, however, greater levels of willingness to resist can be seen among the elderly (50.3 % among those aged above 64), while the lowest among those aged from 18 to 24 (19.9 %). In Estonia, the situation is more balanced among different age groups as the level of willingness to resist is above three-tenths in all age groups – from 30.5 % among the oldest to 39.9 % among the youngest. When the willingness to resist with non-violent and violent means is differentiated, data from all three countries suggests generally greater levels of willingness to resist violently among younger respondents and lower levels among the older ones.
Figure 7 shows the data based on the language spoken in respondents’ families. Peculiarly, the cumulative willingness to resist in Latvia and Lithuania was higher among Russian speaking respondents with the difference among the groups of 2.7 % and 14.7 % in Latvia and Lithuania accordingly; with respect to Lithuania, the issue of the limited sample size mentioned in the previous chapter has to be reiterated. In Estonia, on the contrary, more Estonian-speakers expressed willingness to resist (24.8 % more than Russian-speakers).
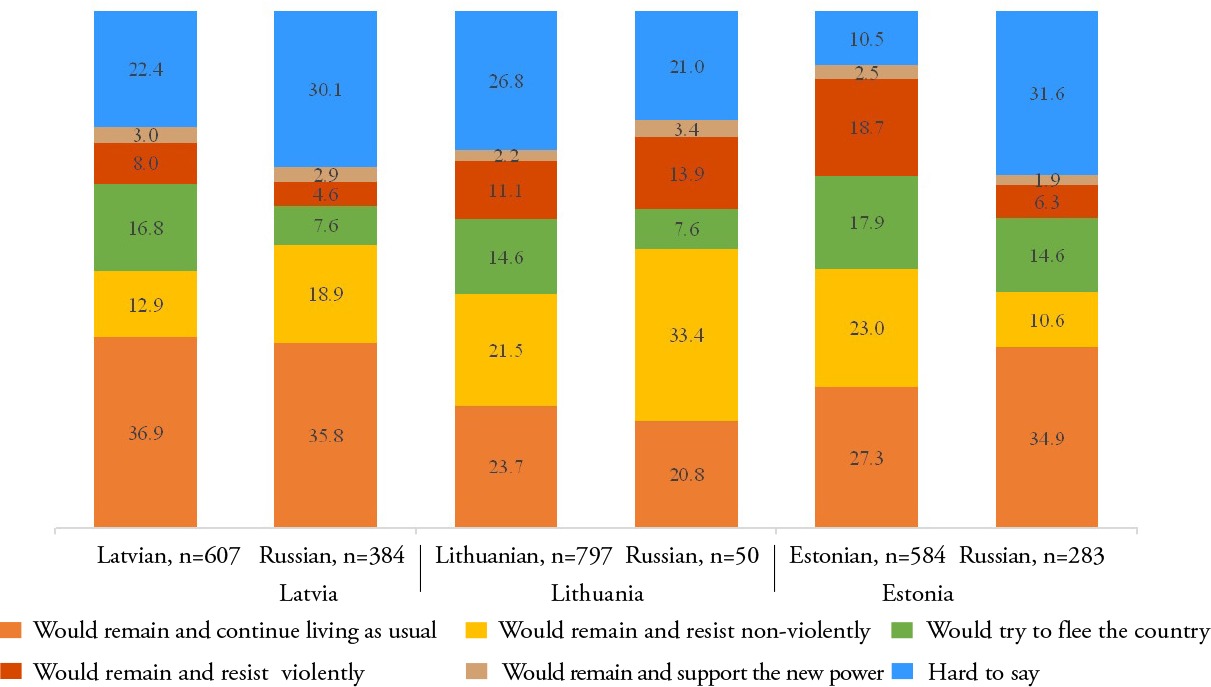
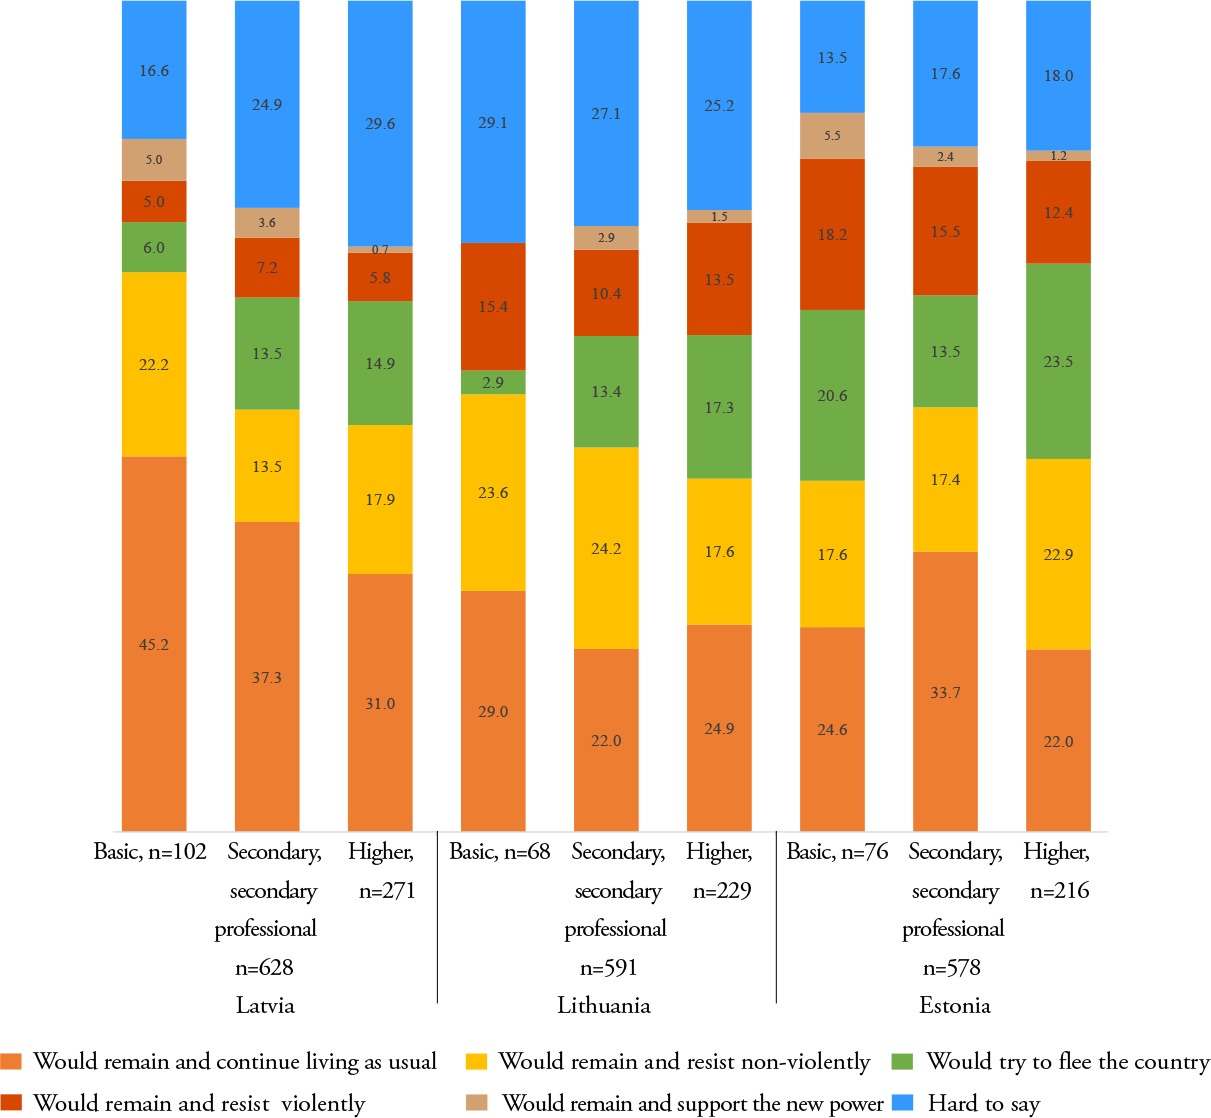
Figure 8 contains the answers of respondents based on their education level. The data provides a rather balanced picture among the three pre-defined education levels. In all three countries, resistance of any form was more often expressed by individuals with basic education, though that level is rather balanced among the categories.
Conclusions
Even though this study is principally based on a single survey, its national representativeness, unified methodological approach and parallel timing provides a notable insight into the societal attitudes towards defence of the countries in question. Trends of the average willingness to defend one’s own country identified here are principally corroborated by other studies from recent years. Since 2014, when the Russian-Ukrainian conflict also inflamed insecurity in the Baltic states, the highest level of willingness to defend one’s country has been consistently recorded in Estonia (Saar Poll 2014, p. 29; Turu-uuringute 2014, p. 28; 2016, p. 29; 2018, p. 32; 2019, p. 39), ahead of the respective level in Latvia (WIN/Gallup International, 2015, p. 2; SKDS, 2016, p. 42; Andžāns et al., 2017, p. 17; Bērziņa and Zupa, 2020, p. 5) and Lithuania (Vileikienė and Janušauskienė, 2016, p. 126; Ramonaitė, Petronytė-Urbonavičienė, Skirkevičius and Vosylius, 2018).
Data from the nationally representative survey of this study, conducted in 2019, similarly suggests that the greatest willingness to defend one’s own country in the Baltics is in Estonia, ahead of Latvia and Lithuania. Willingness to defend Estonia, standing at two-thirds of respondents, is more than twice as high as the respective level in Lithuania. In the latter, only every third respondent expressed willingness to defend the state.
The first question of the survey addressed general willingness to defend one’s own country. The demographic background of the respondents indicates that in all three countries, male respondents are more ready to defend their country than women (the amplitude between genders in all three was almost identical). The situation is more diverse among the countries in terms of age groups. In Latvia, the results across different age groups do not differ significantly. In Lithuania, greater levels of willingness to defend can be seen among the youngest, while in Estonia among the elderly. When the impact of the main language of the family of respondents is assessed, data from all three suggests that Russian speakers are less willing to defend their country. While the difference in this aspect is minimal in Lithuania, it is contrary in Latvia and more so in Estonia. The remaining demographic indicator – the education level – suggests that the most willing to defend their country in all three countries are those with secondary or secondary professional education.
The second question of the survey addressed the reactions of the respondents assuming their country had already been attacked. Compared to the first question, more respondents had difficulties providing an answer to the question. The highest cumulative level of those willing to resist was registered among respondents in Lithuania, slightly ahead of Estonia. The same number was smaller in Latvia, where the lowest values in both violent and non-violent resistance forms were observed. Also, the highest percentage of those willing to continue living as usual was recorded in Latvia. The level of respondents that would support the adversary was equally low in all three countries.
From a demographic perspective, in both Latvia and Estonia, the willingness to engage in any form of resistance was more frequently expressed by men, while the situation was opposite in Lithuania. Peculiarly, the cumulative willingness to resist in Latvia and Lithuania was higher among Russian speaking respondents, contrary to Estonia. The attitudes by education levels suggest a generally balanced outlook among different backgrounds in all three countries. Although resistance of either form would be more often expressed by individuals with basic education.
The findings of this study should be brought to the attention of policy makers in the respective countries, given their comprehension of the importance that societal attitudes play in state defence as a whole. First of all, societal attitudes towards state defence should not be neglected at any time. These should be measured on a regular basis, as it is comprehensively and transparently done in Estonia. Authorities in Latvia and Lithuania, as well as other countries, could take this approach as an example as a part of their national security risk assessments.
Secondly, not only should societal attitudes towards willingness to defend one’s own country and to resist be measured, they should also be followed up by measures to tackle the negative tendencies they indicate. While the situation regarding the willingness to defend the country is relatively comfortable in Estonia, this should not be treated as a reason for complacency. There is still room for progress within certain groups of the society, especially among the Russian speakers. Valuable lessons could be drawn for the policies of Latvia and more so of Lithuania to avert some of the negative trends regarding willingness to defend the countries. For Latvia, similarly to Estonia, one of the main issues to address is the lower level of willingness to defend the country among Russian speakers. A more comprehensive assessment and action should be considered in Lithuania to strengthen the willingness of its inhabitants not only to resist, but also to be ready defend the country in the first place.